
Abstract
Predicting drug–drug interactions (DDI) is crucial for preventing adverse reactions in patients and plays a vital role in drug design and development. However, traditional Chinese medicine (TCM) formulations, typically composed of multiple herbal ingredients with diverse bioactive compounds, present a unique challenge in comprehensively assessing potential adverse interactions among their components. To address this challenge, we propose a novel Dual Graph Attention Network (DGAT) designed to predict TCM drug-drug interactions (TCMDDI) by extracting key structural features of active molecules within the herbal ingredients. Our approach leverages graph-based representations of chemical molecules and employs attention mechanism to extract deep structural features, enabling the effective prediction of TCMDDI by capturing spatial structural relationships among different compounds. Furthermore, we construct a comprehensive dataset encompassing three different categories of herbal ingredients, informed by traditional TCM principles. Experimental results reveal that the proposed DGAT method significantly outperforms currently advanced deep learning techniques, including Graph Convolutional Networks, Weave, and Message Passing Neural Networks. Compared to traditional rule-based two-dimensional molecular descriptors, DGAT more effectively captures the spatial structural information of molecules. Notably, DGAT exhibits robust performance and strong generalizability on unseen samples, providing valuable insights for future research on TCMDDI prediction and advancing the integration of artificial intelligence in TCM studies.
Introduction
Drug-drug interaction (DDI) refers to the phenomenon where the pharmacological or physicochemical properties of one drug are altered by the presence of another drug when administered together, potentially leading to adverse drug events (ADEs), reduced therapeutic efficacy, or other clinical complications1,2,3. DDI has emerged as a critical issue in drug development and patient safety, necessitating robust methods for its prediction and management4,5,6,7. Traditional approaches to DDI detection, such as biological and pharmacological assays, are often time-consuming, labor-intensive, costly, and sometimes lack reproducibility, especially given the vast and growing diversity of drugs8,9,10,11. With the rapid accumulation of biomedical data, artificial intelligence (AI) technologies have shown great promise in addressing these limitations. AI-based methods can significantly shorten drug development cycles, reduce costs, and provide novel insights into drug discovery, while also aiding clinicians in drug selection and medication management12,13,14,15.
Current DDI prediction models can be broadly categorized into traditional machine learning-based methods and deep learning-based methods. Machine learning approaches rely on drug-related features such as chemical fingerprints, structural similarities, and pharmacological properties to predict interactions between drugs16,17. Cheng et al. proposed a heterogeneous network-assisted inference based on novel features (drug phenotypic, therapeutic, chemical, and genomic properties) and four Machine learning methods including naive Bayes (NB), decision tree (DT), k-nearest neighbor (KNN), logistic regression (LR), and support vector machine (SVM)18. On the other hand, deep learning methods leverage multiple computational layers to automatically extract expressive and composite features from raw data, enabling more accurate and flexible DDI predictions19,20,21. Ma et al. presented a novel dual graph neural network based on molecular structure and interactions, which could be sensitive to the structure information of drugs and able to detect the key substructures for DDI22. Zhu et al. proposed a new DDI prediction model based on sequence and substructure features, which integrates drug sequence features and structural features from drug molecule graphs and can more comprehensively and accurately represent drug molecules23. Zhong et al. proposed MeTDDI - a deep learning framework with local-global self-attention and co-attention to learn motif-based graphs for DDI prediction and achieve competitive performance24.
Despite significant progress in DDI prediction for Western medicines, research on drug interactions in traditional Chinese medicine (TCM) remains in its infancy, primarily due to the lack of comprehensive herbal data resources and the inherent complexity of TCM formulations. TCM formulations typically consist of multiple herbal ingredients, each containing a diverse array of bioactive compounds, making traditional DDI prediction methods inadequate for TCM applications. The complex mechanisms of action and synergistic effects among TCM components pose unique challenges for predicting TCM drug-drug interactions (TCMDDI). However, TCMDDI prediction is crucial, as inappropriate use of herbal medicines can lead to severe clinical consequences. For instance, studies have shown that when Kansui is boiled with Glycyrrhiza, the extraction of toxic components (such as euphorbiolol) from Kansui significantly increases compared to boiling it alone, which markedly exacerbates its toxicity. Therefore, ensuring the safety of herbal medicine usage is of paramount importance for both clinical practice and the development of new drugs. According to TCM principles, the pharmacological effects of herbal medicines are primarily exerted through their active constituents, and the types and concentrations of these constituents directly determine the pharmacological effects of the herbs. Thus, identifying interactions among herbal ingredients can be transformed into a problem of recognizing interactions among chemical compounds.
To address these challenges and build on the remarkable success of graph neural networks and attention mechanisms in DDI and TCM research25,26, we propose a Dual Graph Attention Network (DGAT) for predicting DDI in TCM formulations. DGAT represents the interactions between components in TCM formulations as a dual-graph structure, capturing both intra-molecular structural information of TCM components and inter-molecular interactions. This design provides a comprehensive representation of the complex mechanisms underlying TCM drug responses and significantly enhances the model’s ability to understand the synergistic effects of multi-component TCM formulations. Furthermore, we introduce a multi-head attention mechanism to identify critical functional groups within TCM molecules and interactions between components. Through hierarchical attention weight allocation, the model can finely capture key features of drug interaction, enabling precise modeling of TCM DDI mechanisms. In summary, the contribution of this work is threefold: 1)We model the problem of drug response prediction in TCM formulations as a dual-graph structure, combining GNNs and attention mechanisms. 2) We constructed a comprehensive dataset based on TCM-related rules. This dataset not only includes molecular structural information of TCM components but also integrates formulation compatibility rules, providing unique and reliable data support for research on TCM drug response identification. 3) Extensive experiments on the constructed dataset demonstrate that DGAT outperforms existing methods across multiple performance metrics, providing a powerful tool for modern TCM research.
Methods
Datasets
According to “Eighteen Incompatible Herbs or Nineteen Mutual Antagonistic Herbs”, three rules are found28, which are (1) Arum Ternatum Thunb, Trichosanthes Kirilowii Maxim, Fritiliariae Irrhosae Bulbus, Ampelopsis Japonica, Bletilla Striata are incompatible with Aconiti Radix and Aconitum Kusnezoffii Reichb; (2) Sargassum, Radix Euphorbiae Pekinensis, Kansui Radix, Flos Genkwa are incompatible with licorice; (3) Panax Ginseng C. A. Mey, Adenophprae Ae Radix, Radix Salviae, Figwort Root, Sophorae Flavescentis Radix, Asari Radix Et Rhizoma, Radix Paeoniae Rubra are incompatible with Veratrum nigrum L. Due to the pharmacological effects of traditional Chinese medicine being exerted by its active ingredient, the active ingredients of Arum Ternatum Thunb, Trichosanthes Kirilowii Maxim, Fritiliariae Irrhosae Bulbus, Ampelopsis Japonica, Bletilla Striata, Aconiti Radix, Aconitum Kusnezoffii Reichb, Sargassum, Radix Euphorbiae Pekinensis, Kansui Radix, Flos Genkwa, licorice, Panax Ginseng C. A. Mey, Adenophprae Ae Radix, Radix Salviae, Figwort Root, Sophorae Flavescentis Radix, Asari Radix Et Rhizoma, Radix Paeoniae Rubra and Veratrum nigrum L are collected. According to two indexes (OB and DL), the components of each medicinal herb are screened and the corresponding SMILE data are also obtained. The ingredients of incompatible herbs are mutually exclusive. The ingredients of two herbs being incompatible with the same herb are promoted mutually. According to the above principles, the ingredient pairs of herbs are created. According to three rules, Data1 is generated, which includes 18,538 ingredient pairs (6122 exclusive relationships and 12416 promoting relationships). According to rule (1), Data2 is generated, which includes 1061 relationships (392 exclusive relationships and 669 promoting relationships) and Data3 is generated, which includes 550 relationships (147 exclusive relationships and 403 promoting relationships).
Model
This paper proposes a deep computing framework named DGAT for predicting drug-drug interaction in traditional Chinese medicine (TCM) formulations based on Graph Attention Networks, aimed at detecting adverse drug-drug interactions. The overall architecture of the framework is illustrated in Fig. 1.

Overview of the DGAT structure.
The method comprises three main components: (1) input module; (2) dual graph attention network module; and (3) DDI prediction module. In our framework, the DDI in TCM formulations are modeled using a dual graph structure, which captures both the intramolecular structural information and the inter-molecular interaction details. This design comprehensively represents the complex mechanisms underlying DDI in TCM, enhancing our understanding of the synergistic effects of multi-component herbal preparations. Additionally, we incorporate a multi-head attention mechanism to identify key functional groups and their interactions, enabling precise modeling of the DDI mechanisms through a hierarchical attention allocation strategy. Below, we introduce the details of three modules.
Input module
SMILES is a widely used molecular representation method that encodes the chemical structure of a molecule using a sequence of ASCII characters. It is extensively applied in cheminformatics and molecular generation tasks. However, due to its linear nature and the diversity of rules, the same molecule can be represented by multiple SMILES strings, posing significant challenges for subsequent research. Therefore, in this article, we utilize a graph-based structure to represent molecules, treating atoms as nodes in the graph and chemical bonds as edges, with the connections between atoms represented by an adjacency matrix.
To simplify the input format, we designed an input module that automatically converts the SMILES representation of molecules into their corresponding molecular graph representations. This includes three components: the adjacency matrix, node features, and edge features. The adjacency matrix is used to store the connectivity between atoms in the molecule and facilitates message passing during the graph convolution process. In this study, the molecules and their primary features are outlined in Table 1, where each atom is characterized by nine features, and each chemical bond is represented by four features.
Dual graph attentive network
The graph-structured data are first fed into two sets of graph attention layers, where each molecule undergoes multi-layer information aggregation. This allows each node to gradually collect information from its neighbors through the attention mechanism, preserving the most relevant parts. In each layer, every node generates a new vector that encapsulates information from adjacent nodes and edges. After multiple layers of information aggregation, the state vector of each node will contain more neighborhood information. Finally, the updated graph-structured data is aggregated for node and edge information to derive a feature set encompassing the information of all molecular nodes.

The details and mechanism of message passing in DGAT module. On the right side, it shows the flow of graph data between layers. A molecular graph passes through L layers. On the left side, it illustrates the details of the multi-head attention mechanism. The box demonstrate an example of one node aggregating the neighbor infos through single-head attention.
As illustrated in Fig. 2, the process of obtaining the state vector after one stack layer of information aggregation for graph-based data is depicted. To aggregate more structural information within the molecule, the initial state vectors of the nodes are further embedded through multiple attention layers. Each node utilizes the attention mechanism to iteratively gather “messages” from their neighbors. In each graph attention layer, a new state vector is computed for each node. Through multiple attention layers of information aggregation, the state vector of each node integrates more comprehensive structural information.
In a graph attention layer, each node is embedded by aggregating information from its neighbors, and the multi-head attention mechanism is employed to enhance the representational capacity of information aggregation. The calculation process can be described in the following four steps:
-
1.
Self-attention: Each node computes attention coefficients by comparing its feature representation with the feature representations of its neighboring nodes. The specific calculation formula is as follows:
$$\:{e}_{vu}^{k}=a\left(\right[{W}^{k}{h}_{v}^{i},\:{W}^{k}{h}_{u}^{i}\left]\right)$$(1)$$\:{\alpha\:}_{vu}^{k}=softmax\left({e}_{vu}^{k}\right)=\frac{exp\left(LeakyRelu\right({e}_{vu}^{k}\left)\right)}{{\sum\:}_{u\in\:N\left(v\right)}\left(LeakyRelu\right({e}_{vu}^{k}\left)\right)}$$(2)where \(\:k\) is the index of attention heads, \(\:i\) is the index of GAT layers, \(\:{W}^{k}\) is a trainable weight matrix for linear transform, \(\:{h}_{v}\) represent the hidden state vector of target node \(\:v\) and \(\:{h}_{u}\) to the hidden state of neighbor node \(\:u\). \(\:LeakyRelu\) and \(\:elu\) are variations of \(\:Relu\) nonlinear activation function, are used because they are more expressive and could consistently perform better by allowing a nonzero slope for the negative part of the \(\:Relu\) function.
-
2.
Neighbors aggregation: The node aggregates information from its neighbors based on their attention coefficients, producing a weighted sum of neighbor features.
$$\:{h}_{v}^{k}=\sum\:_{u\in\:N\left(v\right)}{(\alpha\:}_{vu}^{k}\cdot\:{W}^{k}\cdot\:{h}_{u})$$(3)Where \(\:N\left(v\right)\) represent the neighbors of node \(\:v\) and \(\:{\alpha\:}_{vu}^{k}\) is the attention coefficients calculated by last step. The \(\:{h}_{v}^{k}\) is aggregated state vector that computed based on the attention coefficients.
-
3.
Multi-head fusion: When all attention heads complete aggregate operation, the updated node features from different heads are averaged to form the final output features for each node.
$$\:{h}_{v}^{{\prime\:}}=\sigma\:\left(\frac{1}{K}\right(\sum\:_{k=1}^{K}{h}_{v}^{k}\left)\right)$$(4)where \(\:K\) represents the number of attention heads, \(\:\sigma\:\) denotes activation function and we use \(\:elu\) function in this work. The data aggregation methods in multi-head attention include concatenation and averaging, and we utilize the averaging method.
-
4.
Feature transformation: The aggregated neighbor features \(\:{h}_{v}^{{\prime\:}}\) and current feature \(\:{h}_{v}^{i{\prime\:}}\) are feed into gate recurrent unit (GRU) to obtain the updated node features.
$$\:{h}_{v}^{i+1}={GRU}^{i}({h}_{v}^{i},\:{h}_{v}^{i{\prime\:}})$$(5)When all nodes have completed the information aggregation, the updated graph data enters the next layer for further aggregation. After \(\:L\) layers of information aggregation, each node contains rich structural information.
To obtain the global structural information of the molecule and achieve embedding of the entire molecule, we assign importance weights to all nodes in the molecule and perform weighted summation. The information aggregation process is illustrated in Fig. 3, and this module comprises a set of learnable parameters that can be dynamically adjusted during training. By performing weighted summation of all nodes, we obtain a state vector that encapsulates the global information of the molecule as its feature representation.
Fig. 3 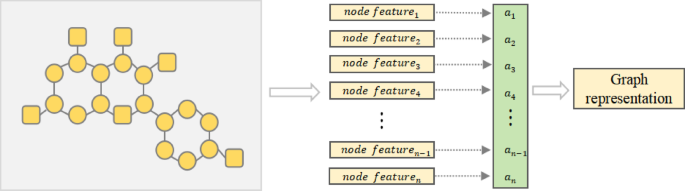
The process of generating graph representation. Calculate the weight for each node, then multiply the node features by the corresponding weights and sum them up to obtain the global representation of the graph.

Drug-drug interaction identification module
After obtaining the feature representations of two molecules, we fuse the representations of the two molecules by concatenate operation. Then, we feed this feature vector into an MLP network, as illustrated in Fig. 4. Where, \(\:\{{\text{x}}_{1},\:{\text{x}}_{2},…,{\text{x}}_{\text{n}}\}\) represents the feature vector of the molecule, where n is the dimension, W denotes the parameter matrix in the MLP module, with f representing the number of neurons in each hidden layer, and j denoting the number of hidden layers. Parameters n, f, and j are all hyperparameters, and their specific values can be determined through Bayesian optimization for optimal parameter search.

The detail of MLP predict module. This module consists of three parts: input layer, hidden layers and output layer.
All modules of DGAT are developed and trained based on the PyTorch framework, utilizing the Adam optimizer for gradient descent optimization, and the whole model is trained in an end-to-end manner. The best set of hyperparameters for each task category is obtained through Bayesian optimization and used to train the model. We employ cross-entropy loss as the loss function, which is defined by the following formula:
Where N is the number of samples, \(\:{\text{y}}_{\text{i}}\) represents the true class labels of the i’th samples, and \(\:{\text{p}}_{\text{i}}\) denotes the predicted probabilities by the model. To avoid overfitting and reduce training time, we introduce an early stopping mechanism in the training pipeline. In each training process, we set a maximum of 1000 epochs, and if there is no improvement in the training loss for 50 epochs or in the validation loss for 60 epochs, the training process is terminated early. This stopping criterion is empirical and may vary across different datasets. All models are trained until they reach the early stopping criterion or the maximum training epochs, indicating that performance improvement has converged.
Experiment results
To evaluate the effectiveness of our method, we conducted experiments on Data1 and Data2 and Data3. The performance of the classifier is evaluated using ROC curves and AUC values. The definitions of Sensitivity (SN), Specificity (SP), Accuracy (ACC), Matthews Correlation Coefficient (MCC) and F1 score are as follows:
Where TP is the number of correctly identified exclusive relationships, FN is the number of exclusive relationships that are incorrectly identified as promoting ones, TN is the number of correctly identified promoting relationships and FP is the number of promoting relationships that are incorrectly identified as exclusive ones.
Models evaluation
To evaluate the generalization and robustness of DGAT, we employed K-fold cross-validation, specifically utilizing three-fold, five-fold, and ten-fold cross-validation approaches for assessment. We compared DGAT against several baseline models, including GCN29, Weave30, MPNN31 (all utilizing graph-structured data), Decision Trees (DT)32, and Long Short-Term Memory networks (LSTM)33 (using 1D data as input), on Data1. The performance of these methods across the different validation approaches (Mean ± SD) are shown in Table 2. It can be observed that DGAT outperforms other methods in all cross-validation methods, achieving an SN score exceeding 98%, which indicates its capability to identify the vast majority of positive samples. Conversely, the Weave model achieves the highest SP score, demonstrating its strong capability to identify negative samples across all three experimental setups. However, the Weave model exhibits a slightly lower identification rate for positive samples compared to other methods, which affects its overall performance and results in a relatively lower accuracy.
Furthermore, across all three cross-validation methods, DGAT achieves the highest performance in ACC, MCC, and F1 metrics, while exhibiting the smallest performance variance. This underscores its robust representational learning ability and overall robustness. The outstanding performance of ACC indicates high prediction accuracy for both positive and negative samples. Higher MCC value signifies a strong correlation between predicted and actual values, while the F1 score takes into account both precision and recall, making these two metrics crucial for comprehensively evaluating the predictive capabilities of positive and negative samples of models. The optimal results achieved by DGAT in both MCC and F1 further affirm its superior performance compared to other models.
Notably, other graph convolution-based models, including GCN, Weave, and MPNN, also achieved MCC and F1 scores exceeding 90%, demonstrating their strong capability in molecular structure representation tasks. In contrast, although LSTM and DT performed well on individual metrics such as SN and SP, their performance on comprehensive metrics was significantly inferior to graph convolution-based methods. On the other hand, GNNs can effectively extract spatial structural information of molecules through graph convolution operations, thereby capturing complex intra-molecular relationships. This enables GNNs to achieve superior performance and stability in both comprehensive metrics and robustness to data variations.
Moreover, to validate our method’s performance, we conducted a paired t-test between the proposed method and the other 5 baseline methods according to the MCC values on three-fold cross-validation with a significance level of 0.05. The results revealed statistically significant differences between DGAT and the baselines, with p-values of 0.00003 (DT), 0.000029 (LSTM), 0.016 (GCN), 0.047 (MPNN), and 0.0012 (Weave). These findings robustly validate the effectiveness of the dual-graph structure and attention mechanism in enhancing model performance.

The ROC and PR curves of six methods on Data1 through three-fold, five-fold and ten-fold cross-validation.
The Receiver Operating Characteristic (ROC) curve and Precision Recall (PR) curve are commonly used tools for evaluating binary classification algorithms. The ROC curve is based on the False Positive Rate (FPR) and True Positive Rate (TPR), while the PR curve is derived from precision and recall metrics. By varying the classification threshold, multiple pairs of FPR and TPR coordinates, as well as precision and recall coordinates, can be obtained to construct these curves. The Area Under the ROC Curve (AUC) quantifies the area beneath the curve, with values ranging from 0 to 1. According to the predicted results depicted in Table 2, we plotted both ROC and PR curves of four models across three-fold, five-fold, and ten-fold cross-validation, as illustrated in Fig. 5. It is evident from both curves that the DGAT model outperforms the other three models in all three cross-validation methods, achieving the highest AUC value. This clearly indicates that the DGAT model possesses high accuracy and generalization capability. On the other hand, it is also apparent that the prediction results of GCN, Weave and MPNN are competitive, which aligns with the experimental results presented in Table 2. This further confirms the effectiveness of graph neural networks in learning molecular representations, enabling them to effectively capture important structural information within molecules.
Cross-dataset prediction
To evaluate the robustness of the DGAT model when confronted with unseen data, we conducted experiments using Data2 as the training set and Data3 as the test set. This experimental design significantly increases the complexity of the task of identifying Traditional Chinese Medicine-Drug Interactions (TCM DDI), as the test set includes samples not present in the training set. This setup undoubtedly raises the bar for the model’s generalization capability and robustness, as the model must effectively handle data it has never encountered during training.
We selected Support Vector Machines (SVM)34, Decision Trees (DT), k-Nearest Neighbors (KNN)35, Long Short-Term Memory networks (LSTM), and Fully Connected Neural Networks (FCNN)36 as baseline models. The inputs to these models were molecular descriptors generated through RDKIT. Molecular descriptors are a rule-based, representative approach to characterizing the spatial structural information of molecules, including Topological Polar Surface Area (TPSA), the number of valence electrons, the number of radical electrons, charge information, and counts of aliphatic carbon rings, among others. These descriptors provide rich molecular features that enhance the predictive performance of the models. Each experimental group was run 10 times under different random seeds, with the results summarized in Table 3.
From the table, we can observe that the DGAT model outperforms other models in terms of SN, ACC, MCC, and F1 metrics. Although it did not achieve the optimal value for the SN metric, its overall performance further corroborates the robust representational capability and transferability of graph convolution-based models, as they can effectively represent molecules that were not seen during the training phase. In contrast, we observed that SVM, DT, KNN, and FCNN attained a perfect score of 100% on the SP metric, indicating their success in identifying all negative samples. However, the performance of SVM, DT, and FCNN on the SN metric was poor, with an accuracy of only around 34%. This may be attributed to the imbalance between positive and negative samples in the test set; to minimize loss, these models predicted a majority of samples as negative. This imbalance can lead to a bias in the learning direction of the algorithms. Furthermore, the result highlights the significant challenges associated with predicting unseen data and indicates that simpler classification methods, such as SVM and KNN, are insufficient for the task of identifying detrimental interactions between molecules. The LSTM model performed closely to DGAT on the SN metric, demonstrating its strong data fitting ability; however, it had the worst performance on the MCC metric, indicating that sequential models are suboptimal for the task of recognizing harmful molecular interactions.

The ROC and PR curves of six methods on data2 and data3.
The ROC and PR curves reveal that the SVM, DT, LSTM, and KNN methods exhibited poor performance, aligning with the results presented in Fig. 6. Notably, the FCNN model exhibited strong performance on the ROC curves, with corresponding AUC values exceeding 90%. However, this finding does not align with its overall performance presented in Table 3. This discrepancy may arise from overfitting in the FCNN model, which predominantly predicts the majority of samples as negative. Furthermore, the imbalance between positive and negative samples in the test set contributes to the divergence between its AUC performance and metrics such as MCC and F1. In contrast, DGAT demonstrates consistent performance, achieving optimal results across both datasets.

The identification DDI with Data3 by our method.
The identification of DDI by DGAT is depicted in Fig. 7, which describes the relationships among compounds between Arum Ternatum Thunb, Trichosanthes Kirilowii Maxim, Fritiliariae Irrhosae Bulbus, Ampelopsis Japonica, Bletilla Striata and Aconiti Radix. The solid line denotes the exclusive relationship between two compounds. The dotted line denotes the incorrectly identified exclusive relationship. Two molecules without lines indicate that they are compatible. From Fig. 7, our method could predict that Arum Ternatum Thunb, Trichosanthes Kirilowii Maxim, Fritiliariae Irrhosae Bulbus, Ampelopsis Japonica, Bletilla Striata and Aconiti Radix are incompatible with Aconiti Radix.
Comparison between different molecular representations
To validate the effectiveness of the molecular representations generated by the GAT model, we compared it with classical molecular fingerprint methods ECFP6 and MACCS. ECFP6 is a fingerprinting technique based on the Extended Connectivity Fingerprint (ECFP), comprising 2048 features. These features are derived by retrieving all possible molecular paths from the atoms within a radius of six, where each bit indicates the presence or absence of a specific substructure. MACCS consists of 166 molecular feature bits, such as isotopes, atom numbers of Nitrogen and Oxygen, 4 M RING, and Group VIII elements.

ACC and MCC performances of five methods using ECFP6 (blue), MACCS features (orange) and DGAT features (green) as input respectively.
In this experiment, we utilized the same dataset in Sect. 2.2. Three types of molecule representation are fed into SVM, DT, KNN, LSTM, and FCNN to assess how different molecular representations influence the outcomes of adverse drug-drug interactions recognition. The experimental results are illustrated in Fig. 8, from which we can draw several noteworthy observations. First, when using ECFP6 and MACCS molecular fingerprints as inputs, the predictive performance of different models shows minimal variation. This may be attributed to the inability of these two molecular fingerprints to provide clear features, coupled with the inherent challenges of the distribution of dataset, which negatively impacts model predictions. Secondly, ECFP6 outperforms MACCS across all models, likely due to its greater feature dimensionality, which allows for a richer representation of molecular structural information. Finally, we observed significant improvements in model performance when leveraging the molecular representations generated by GAT. Notably, the performance of KNN slightly declined compared to ECFP6, possibly because the distribution of positive samples in the dataset is scattered, making distance-based classification more challenging. On the other hand, the molecular representations produced by GAT significantly enhanced the predictive accuracy of the LSTM and FCNN model, exceeding 90%. This outcome indicates that the molecular features generated by GAT effectively capture essential structural information, which deep neural networks can learn from more effectively.
Conclusions
In this work, we have proposed a method for predicting drug-drug interactions in traditional Chinese medicine (TCMDDI) based on a DGAT model and conducted extensive experiments on a self-constructed TCM dataset. The experimental results indicate that the proposed method significantly outperforms other graph neural network-based approaches in predicting adverse reactions to herbal medicines. Additionally, compared to rule-based molecular descriptors, DGAT exhibits remarkable robustness, demonstrating superior performance over traditional machine learning methods. Notably, when compared to classic molecular fingerprinting methods, such as ECFP6 and MACCS, the molecular representation features extracted by DGAT notably enhance the prediction accuracy of conventional machine learning techniques, including SVM, DT, LSTM and FCNN. These results highlight the capability of the DGAT model to effectively learn the molecular representation features of herbal constituents through the graph attention mechanism, capturing their critical structural information by simultaneously conducting feature learning on both molecules. This ensures that the model can more accurately predict interactions related to TCM.
This work provides new insights for future studies in the field. The prediction of adverse interactions among multiple constituents in TCM formulations can be transformed into a DDI problem involving multiple molecules. By utilizing the DGAT model to extract key structural features of these molecules, effective reaction predictions can be achieved. Furthermore, we have released a new dataset for TCM constituent interactions, which will greatly assist subsequent researchers in their studies and validations, thereby advancing the development of TCM interaction prediction technologies. Importantly, DGAT demonstrates robust performance and generalizability on unseen samples, effectively assisting drug developers in identifying potential adverse reactions among TCM, thereby accelerating the research process. Although the proposed model achieves high accuracy in predicting drug-drug interactions in traditional Chinese medicine (TCMDDI), several limitations warrant attention. First, the dataset for herbal compound interactions remains limited in both scale and diversity, which may constrain the generalizability and predictive robustness of deep learning models. The current data primarily focus on a subset of herbal combinations, potentially overlooking rare but clinically significant interactions. Furthermore, the lack of external validation across diverse herbal reaction datasets restricts the broader applicability of our approach.
In future work, we plan to conduct more extensive data collection and integration to ensure comprehensiveness and representativeness. Additionally, we aim to broaden the scope of the method to identify potential adverse reactions for a wider variety of herbs. We also intend to incorporate more prior knowledge and diverse feature types into our approach, such as three-dimensional structural information of compounds, to improve the accuracy of recognizing interactions among herbal compounds. Through these efforts, we expect to further enhance the model’s performance and its potential for practical applications.
Data availability
The datasets and model code used and analyzed in this study are open source and available at: https://github.com/dooliu/DGAT4TCMDDI.
References
Bachmann, K. A. Predicting inhibitory drug-drug interactions and evaluating drug interaction reports using Inhibition constants. Ann. Pharmacother. 39(6), 1064–1072 (2005).
Lee, J., Beers, J. L., Geffert, R. M. & Jackson, K. D. A review of CYP-mediated drug interactions: mechanisms and in vitro drug-Drug interaction assessment. Biomolecules 14(1), 99 (2024).
Huang, J. et al. Systematic prediction of pharmacodynamic drug-drug interactions through protein-protein-interaction network. PLoS Comput. Biol. 9(3), e1002998 (2013).
Niu, J., Straubinger, R. M. & Mager, D. E. Pharmacodynamic drug-drug interactions. Clin. Pharmacol. Ther. 105(6), 1395–1406 (2019).
Malki, M. A. & Pearson, E. R. Drug-drug-gene interactions and adverse drug reactions. Pharmacogenomics J. 20(3), 355–366 (2020).
Haerig, T. R. et al. Potentially inappropriate medication including drug-drug interaction and the risk of frequent falling, hospital admission, and death in older adults - results of a large cohort study (getABI). Front. Pharmacol. 14, 1062290 (2023).
Sun, X. et al. Deep convolution neural networks for drug-drug interaction extraction. In IEEE International Conference on Bioinformatics and Biomedicine (bibm), 2018, 1662–1668. (2018).
Qiu, Y. et al. A comprehensive review of computational methods for drug-drug interaction detection. IEEE/ACM Trans. Comput. Biol. Bioinform. 19(4), 1968–1985 (2022).
Greenblatt, D. J. Drug-drug noninteractions. Cardiovasc. Ther. 27(4), 226–229 (2009).
Gupta, S., Laghuvarapu, S. & Priyakumar, U. D. GraphDDI: graph neural network for prediction of drug-drug interaction. In Artificial Intelligence in Healthcare. AIiH 2024 (eds Xie, X. et al.). Lecture Notes in Computer Science, vol. 14975. 17–30. (Springer, 2024).
Shtar, G. et al. A simplified similarity-based approach for drug-drug interaction prediction. PLoS One. 18(11), e0293629 (2023).
Abbasi, K. et al. Deep learning in drug target interaction prediction: current and future perspectives. Curr. Med. Chem. 28(11), 2100–2113 (2021).
Zhang, Y. et al. Application of artificial intelligence in drug-drug interactions prediction: a review. J. Chem. Inf. Model. 64(7), 2158–2173 (2024).
Chen, S., Li, T. & Yang, L. Artificial intelligence-driven prediction of multiple drug interactions. Brief. Bioinform. 23(6), bbac427 (2022).
Lin, X. et al. Comprehensive evaluation of deep and graph learning on drug-drug interactions prediction. Brief. Bioinform. 24(4), bbad235 (2023).
Takeda, T. et al. Predicting drug–drug interactions through drug structural similarities and interaction networks incorporating pharmacokinetics and pharmacodynamics knowledge. J. Cheminform. 9(1), 1–9 (2017).
Ran, B. et al. Drug-drug interactions prediction using fingerprint only. Comput. Math. Methods Med. 2022, 7818480. (2022).
Cheng, F. & Zhao, Z. Machine learning-based prediction of drug–drug interactions by integrating drug phenotypic, therapeutic, chemical, and genomic properties. J. Am. Med. Inform. Assoc. 21(e2), e278–e286 (2014).
Dou, M. et al. Drug-Drug interaction relation extraction based on deep learning: A review. ACM Comput. Surveys. 56(6), 1–33 (2024).
Li, X. et al. Deep learning for drug-drug interaction prediction: A comprehensive review. Quant. Biology. 12(1), 30–52 (2024).
Luo, H. et al. Drug-drug interactions prediction based on deep learning and knowledge graph: A review. iScience 27(3), 109148 (2024).
Ma, M. & Lei, X. A dual graph neural network for drug-drug interactions prediction based on molecular structure and interactions. PLoS Comput. Biol. 19(1), e1010812 (2023).
Zhu, J., Che, C. & Jiang, H. SSF-DDI: a deep learning method utilizing drug sequence and substructure features for drug-drug interaction prediction. BMC Bioinform. 25(1), 39 (2024).
Zhong, Y. et al. Learning motif-based graphs for drug–drug interaction prediction via local–global self-attention. Nat. Mach. Intell. 6(9), 1094–1105 (2024).
Huang, S. et al. Hierarchical and dynamic graph attention network for drug-disease association prediction. IEEE J. Biomedical Health Inf. (2024).
Wenbo, Z. et al. LAMGCN: traditional Chinese medicine herb recommendation via LSTMs with attention mechanisms and graph convolutional networks. ACM Trans. Asian Low-Resour Lang. Inf. Process. (2025).
Duan, X. et al. The study was based on the composition of toxic effect which was by the compatibility of eighteen incompatible medicaments of licorice with euphorbia and Gan Sui ban Xia Decoction, Lishizhen med. Mater. Med. Res. 29(4), 849–851 (2018).
Liu, J., Zhong, G. & Wang, X. Chinese patent medicines containing eighteen incompatible herbs or nineteen mutual antagonistic herbs in pharmacopoeia of People’s Republic of China (I, 2010). Chin. J. Experimental Traditional Med. Formulae. 17(4), 213–217 (2011).
Kipf, T. N. & Welling, M. Semi-supervised classification with graph convolutional networks, arXiv preprint arXiv: 1609.02907, (2016).
Kearnes, S. et al. Molecular graph convolutions: moving beyond fingerprints. J. Comput. Aided Mol. Des. 30, 595–608 (2016).
Gilmer, J. et al. Neural message passing for quantum chemistry. In International Conference on Machine Learning PMLR, 1263–1272. (2017).
Myles, A. J. et al. An introduction to decision tree modeling. J. Chemom. 18(6), 275–285 (2004).
Graves, A. & Graves, A. Long short-term memory. In Supervised Sequence Labelling with Recurrent Neural Networks, 37–45. (2012).
Hearst, M. A. et al. Support vector machines. IEEE Intell. Syst. Their Appl. 13(4), 18–28 (1998).
Peterson, L. E. & K-nearest neighbor. Scholarpedia, 4(2): 1883. (2009).
Popescu, M. C. et al. Multilayer perceptron and neural networks. WSEAS Trans. Circuits Syst. 8(7), 579–588 (2009).
Acknowledgements
This work was supported by Shandong Natural Science Fund Project (No. ZR2023MF061), the Key Research and Development Program of Shandong Province, China (No. 2022TZXD0019), the talent project of “Qingtan Sholar” of Zaozhuang University, the Key Research Program of the Science Foundation of Shandong Province (ZR2020KE001), the PhD research startup foundation of Zaozhuang University (No.2014BS13), and Zaozhuang University Foundation (No. 2015YY02).
Author information
Authors and Affiliations
Contributions
B.Y. conceived the method. J.W. collected the data. Y.L. designed the method. D.S. conducted the experiments, Y.L. analyzed the results, D.S. and B.Y. wrote the main manuscript text. All authors reviewed the manuscript.
Corresponding authors
Ethics declarations
Competing interests
The authors declare no competing interests.
Additional information
Publisher’s note
Springer Nature remains neutral with regard to jurisdictional claims in published maps and institutional affiliations.
Rights and permissions
Open Access This article is licensed under a Creative Commons Attribution-NonCommercial-NoDerivatives 4.0 International License, which permits any non-commercial use, sharing, distribution and reproduction in any medium or format, as long as you give appropriate credit to the original author(s) and the source, provide a link to the Creative Commons licence, and indicate if you modified the licensed material. You do not have permission under this licence to share adapted material derived from this article or parts of it. The images or other third party material in this article are included in the article’s Creative Commons licence, unless indicated otherwise in a credit line to the material. If material is not included in the article’s Creative Commons licence and your intended use is not permitted by statutory regulation or exceeds the permitted use, you will need to obtain permission directly from the copyright holder. To view a copy of this licence, visit http://creativecommons.org/licenses/by-nc-nd/4.0/.
About this article

Cite this article
Yang, B., Song, D., Li, Y. et al. Drug-drug interaction prediction of traditional Chinese medicine based on graph attention networks. Sci Rep 15, 18635 (2025). https://doi.org/10.1038/s41598-025-00725-9
Received:
Accepted:
Published:
DOI: https://doi.org/10.1038/s41598-025-00725-9
