
Abstract
The long span deck type concrete filled steel tube (CFST) arch bridge encounters considerable safety risks under intricate traffic loads because to its extensive span, elevated columns, and pronounced dynamic sensitivity.This study utilizes the Wujiang Bridge, the world’s longest span at 504 m, to elucidate the significant impacts of vehicle velocity, eccentric loading, and boom rigidity on both the overall and local dynamic responses of the bridge, employing finite element modeling (MIDAS) and vehicle-bridge coupling dynamics analysis. The findings indicate that the standard impact coefficient significantly underrepresents the dynamic effect. The impact coefficient for the lateral displacement of the end column is 0.426, significantly exceeding the standard value of 0.05. The velocities of 20 m/s and 28 m/s represent the crucial points of dynamic response; eccentric loading considerably enhances the torque effect on arch ribs (difference of 0.236).The study underscores the deficiencies of current codes in assessing local components and presents urgent recommendations: enhance bridge deck maintenance standards to minimize irregularities, enforce vehicle speed segment control, reinforce the dynamic design of critical elements such as tall columns and short booms, and develop a multi-parameter collaborative optimization model to enhance life safety. The findings offer theoretical backing and practical direction for the meticulous design, specification modification, and secure operation and maintenance of long span arch bridges.
Introduction
At present, the bridge structures are mainly subjected to three kinds of dynamic loads, which are vehicle loads, seismic actions, and wind loads1. Among these factors, seismic activities manifest at low frequencies, and wind loads exert minimal influence on arch bridge structures; therefore, vehicle loads are the primary subject of study on the dynamic loads of arch bridges. The vehicle load has a dynamic amplification impact on the bridge, and the vibration of the bridge will in turn affect the vehicles on the bridge, resulting in a more complex vibration process, which is called the vehicle-bridge coupling vibration problem2,3. In vehicle-bridge coupled vibration, multiple factors influence the vibrational impacts on bridge structures, including vehicle loads, speed, distance, lane changes, braking, and the structural specifications of the bridge. The effects of vibration are inherently influenced by the structural characteristics of the bridges.
In order to analyze the impact effects of large-span arch bridges, the approaches are mainly to establish and solve the vibration differential equations of the two subsystems of the vehicles and bridges, and their interaction is reflected by iterative calculations4,5,6. In the past, a large number of scholars have carried out a lot of research using similar concepts. Ding et al. investigated how vibration from the vehicle-bridge coupling affected the expansion joints of the bridges by examining the expansion joint’s structure, the vehicle’s load, and the internal force of the bridge7. The effects of vehicle speed, load eccentricity, and bridge span on the impact coefficient were noted by Moghimi et al.8. Bruno et al.9 studied the dynamic impact of long-span cable-stayed bridges based on the influencing variables of vehicle self-weight, cable-stayed tower, and other structures. Jiang10 studied the vehicle-bridge coupling vibration of three types of bridge structural systems, namely long-span continuous beam, continuous rigid frame, and continuous beam-rigid frame combination system, and explored the variation laws of deflection impact coefficient and bending moment impact coefficient according to the changes of multiple parameters such as vehicle body mass, vertical fundamental frequency of vehicle vibration, and number of vehicles. Ma11 and Cao et al.12 discussed the coupling vibration characteristics of the vehicle-bridge for the curved beam bridge and found that many factors, such as curvature radius, vehicle type, and bridge floor roughness, had significant effects on the vehicle-bridge coupling. Shao13 studied the impact effect and bending effect of the suspension boom system of the arch bridge under the coupling action of vehicle-bridge and revealed the reason why the short suspension boom of the arch bridge is more prone to fatigue failure. Li14 studied the vehicle-bridge coupling vibration response under the action of different vehicle models and multiple vehicles for the unique bridge type of low tower cable-stayed bridge and analyzed the sensitivity of structural parameters such as bridge span to the vehicle-bridge coupling vibration response. Zeng et al.15 studied the dynamic characteristics and seismic response of a long-span single-tower cable-stayed bridge with single cable plane under different cable plane arrangements by establishing a finite element model and combining dynamic load tests. It was found that the double-cable plane arrangement could slightly reduce the main beam torsion but could not completely eliminate it. It is suggested that the single-cable plane arrangement should be adopted when the main beam is narrow, and the double-cable plane arrangement should be adopted when the main beam is wide to optimize the seismic performance.
The above studies on Bridges under vehicle-bridge coupling are aimed at a variety of bridge types. In recent years, the research on vehicle-bridge coupling effect of concrete-filled steel tube arch bridge has gradually increased. Zhao et al.16 examined the vehicle-bridge coupling vibrations of long-span concrete-filled steel tube arch bridges utilizing the finite element method and a multi-rigid body dynamics model in conjunction with the Newmark-β method. They discovered that the impact coefficient typically exceeds the normative value and is considerably influenced by bridge deck roughness, vehicle velocity, and boom cross-sectional area. The research team of Hou and Xu17 conducted field testing and finite element simulation analysis, revealing that the support gap and expansion joint of the long-span concreted-filled steel tube arch bridge significantly exacerbated the longitudinal and vertical displacement responses of the main beam under vehicular load, with notable stress amplitude variations in the short boom due to support failure. It is suggested to replace the support and adjust the boom force to reduce the dynamic impact effect. It provides an important basis for the maintenance of long-span concrete-filled steel tube arch bridge. Yao et al.18 developed a vehicle-bridge coupling model utilizing finite element software ANSYS and multi-body dynamics software Universal Mechanism, and examined the impacts of bridge deck irregularity, travel distance, damping ratio, and vehicle-bridge co-frequency resonance. Research indicated that irregularities in the bridge deck exert the most substantial influence on dynamic response, whereas vehicle-bridge co-frequency resonance markedly enhances the bridge’s response. The vibration effect can be significantly mitigated by augmenting the running distance and the damping ratio. The research team comprising Hu W.L., Zhou B., and Zheng19 established a vehicle-bridge coupling vibration model through field testing and numerical simulation. They discovered that vehicle weight exerts the most substantial influence on the bridge’s dynamic response, while environmental corrosion markedly diminishes the fatigue life of the short boom. It offers theoretical backing for the fatigue design of concrete-filled steel tube arch bridges. Jiang20 and Yu et al.21 developed a vehicle-bridge coupling vibration model to examine the effects of bridge floor flatness and the concrete emptying rate of the arch rib. They concluded that bridge floor flatness significantly influences dynamic response, and that the emptying rate at the L/4 position substantially increases the impact coefficient more than at the arch top position, indicating that bridge floor flatness should be considered in the calculation of the actual impact coefficient.
The aforementioned studies have produced some insightful findings in vehicle-bridge coupling vibrations. However, a number of factors are connected to the axle system’s coupling vibration. This study focuses on the Wujiang Bridge, the largest long span deck type CFST arch bridge globally, examining its behavior under varying vehicle offset situations, speeds, and arch column strengths. The reason for examining these three characteristics is their specificity. The vehicle load directly impacts the top of the column on the arch, and variations in velocity are acutely responsive to the axial force distribution of the arch rib, potentially inducing coupling vibrations on the arch rib surface. The torsional stiffness of the CFST composite section is inadequate, and eccentric loading readily induces localized concrete cracking. The rigidity of the column and the arch rib collectively influence the dynamic properties of the bridge, with elevated column stiffness potentially aligning the structural frequency with typical vehicle excitation frequencies, hence heightening the likelihood of resonance. Consequently, the dynamic properties of the vehicle-bridge interaction of the steel tube concrete arch bridge were analyzed, encompassing the dynamic forces and deformations resulting from this coupling effect. This is crucial for the logical selection of diverse structural parameters of this bridge type and the associated vehicle-bridge coupling study.
Theoretical method
Theoretical method of vehicle-bridge coupling vibration
For the vibration differential equations of bridge structures in general22, the coupling between the vehicle and the bridge is established by the direct stiffness method and the superposition method of vibration patterns. Among them, the direct stiffness method is used to discretize the whole bridge through nodes and units under the condition that the whole bridge model is a linear subsystem, and its power balance equation is expressed as follows:
In the above equation, \(M_{{\text{b}}}\) is the nodal mass matrix of the bridge structure, \(C_{{\text{b}}}\) is the nodal damping matrix of the bridge structure, \(K_{{\text{b}}}\) is the node stiffness matrix of the bridge structure, \(U_{{\text{b}}}\) is the nodal displacement vector of the bridge structure, and \(F_{{\text{b}}}\) is the load vector of the vehicle acting on the bridge, which is related to the weight of the vehicle, the unevenness of the bridge deck, and so on.
When establishing the dynamic equations of the system for the coupled vibration system23, the equations of motion of the vehicle can be expressed as:
In the above equation, \(M_{{\text{v}}}\), \(C_{{\text{v}}}\) and \(K_{{\text{v}}}\) are the mass matrix, damping matrix and stiffness matrix of the vehicle, respectively; \(d_{{\text{v}}}\) is the displacement matrix of the vehicle; \(f_{{{\text{vg}}}}\) is the gravity load matrix on the vehicle, and \(F_{{{\text{vb}}}}\) is the force matrix of the bridge deck on the vehicle.
The equation of motion of the bridge is expressed as follows:
In the above equation, \(M_{{\text{b}}}\), \(C_{{\text{b}}}\) and \(K_{{\text{b}}}\) are the mass matrix, damping matrix and stiffness matrix of the bridge, respectively; \(d_{{\text{b}}}\) is the displacement matrix of the bridge; and \(F_{{{\text{bv}}}}\) is the matrix of forces acting on the deck of bridge by the vehicle.
According to the displacement coordination relationship and interaction force relationship of axle contact points, the following coupled axle vibration equations can be established23.
In the above equation, \(F_{{\text{G}}}\) is the gravity of the vehicle; \(C_{{\text{b - b}}}\), \(C_{{\text{b - v}}}\), \(C_{{\text{v - b}}}\) denote damping due to axle interaction; \(K_{{\text{b - b}}}\), \({\text{K}}_{{\text{b - v}}}\), \({\text{K}}_{{\text{v - b}}}\) denote the stiffness due to axle interaction; \(F_{{\text{b - r}}}\) and \(F_{{\text{v - r}}}\) are contact forces24.
Simulation of the road surface roughness
A large number of scholars have studied the vehicle-bridge coupling for many years and found that the bridge surface roughness is an influential factor that cannot be ignored in the study of vehicle-bridge coupling. Pavement roughness is considered to be a stable and uniform Gaussian random process with a zero mean value for each state25. According to the GB/T7031-2005 standard26, roughness is simulated by the following power spectral density formula:
In the above equation, \(n\) is the number of waves per unit length, expressed in m−1; \(n_{0}\) is the standard wave number per unit length, which is 0.1 m−1; \(G_{d} (n_{0} )\) is the unevenness coefficient corresponding to the standard wave number, the unit is m; \(w\) is the frequency index that determines the frequency structure of the pavement spectrum.
Then a Fourier change is performed on the above formula to achieve the final roughness simulation:
In the above equation, \(X\) is the distance along the direction of the route, in m; \(\theta_{k}\) is the uniformly distributed random phase angle between 0 and 2π; \(\Delta\) is the distance between the continuous coordinates of the road shape; \(n_{k}\) is the frequency of road irregularity at \(k\).
In this paper, based on the survey of real bridge data, the reference spectral density of the corresponding grade is found according to the standard, and the influence of bridge surface roughness is finally controlled.
Research on dynamic impact coefficients of highway bridges
Vehicles driving will have certain impact effects on the bridge structures, thus increasing the dynamic response of the bridge, and this impact effect is often characterized by the dynamic impact. In the past decades, as the bridge has been the focus of attention, many scholars have conducted a large number of studies on the dynamic impact coefficient of bridges27, because of its many complicated influencing factors, in the value of the dynamic impact coefficient has not been able to reach a consensus so far, and needs to be studied futhermore.
The common-used dynamic impact factor or impact factor (IM) is calculated as follows.
where \(R_{{{\text{dyn}}}}\) is the maximum dynamic response of the bridge at the study point under vehicle load; \(R_{{{\text{sta}}}}\) is the maximum static response of the bridge at the study point under the corresponding static vehicle load.
The impact coefficient study is a crucial component in the evaluation of bridge as well as a major guiding principle in the design of bridges. Numerous researchers have conducted extensive simulations and analyses on the coupled vibration of vehicles and bridges, and they have discovered that the impact coefficient is affected by various factors, including vehicle speed, weight, wheelbase, suspension parameters, type of bridge structure, and unevenness of the deck of bridge. Therefore, the influence of unevenness, vehicle weight, and speed on the impact coefficient of the deck of bridge is the focus of many researchers. And these impact factors mentioned above are more obvious on large-span bridges, so it is necessary to study the impact coefficient of the world’s largest spanning top-bearing steel-tube concrete arch bridge. In this paper, Eq. (8) is used to express the dynamic impact coefficient produced by vehicles on the bridge.
Modeling of the longet deck type CSFT arch bridge in the world
Wujiang bridge is the longest deck type CSFT arch bridge in the world up to now, whose main span is 504 m long. It is made up of the arch ribs, girder, column stiffening system, and so on. The main arch rib is composed of 8 steel tubes whose diameter is1400mm, crossbars and wind braces to form a spatial frame structure. Steel tubes is fiiled with C70 self-compacting compensatory-shrinkage concrete28. The columns on the arch ribs adopt double-column rectangular steel box structure with equal cross-section; the deck system is a continuous combined structure of channel steel box girders and ultra-high performance concrete (UHPC) deck slabs with a span of 33.6 m29; and the columns on the arches are rigidly connected to the steel girders of the deck system with longitudinal movable spherical steel bearings and transverse limit stops at the connecting abutments. Both sides of the arch ribs adopt enlarged foundations.
MIDAS software is used to establish the FEM model of the whole bridge according to the design drawings, as shown in Fig. 1. There are 3307 nodes and 5991 units for the whole bridge. In order to simulate the contact features of the arch ribs and concrete in the pipes, the steel pipes and the concrete arch ribs are simulated by independent calculation rather than converted section, i.e., their material properties of the steel pipes and concrete are calculated and superposed, respectively. Steel pipes and the concrete in the pipes, the steel girder, and the deck of the bridge are established as a common-node double-unit type.

MIDAS FEM model of main span of the full bridge.
In the model, the arch rib’s chords, webs, wind braces and other arch rib structures, as well as columns on arch ribs and steel girders of the deck system, are all made of Q355ND steel material. The deck are simulated by the plate unit with a thickness of 25 cm, and the rest part are simulated by spatial beam units. The supports between the main girders and piers is modeled by a general connection fixed in the longitudinal and vertical directions; and the rest of the constraints, including beams and columns, columns and arches, etc., are all elastic connections. The arch feet of the arch ribs, as well as the junction piers, are simulated by the general supports of the consolidation. Meanwhile, according to the design drawings, the lanes in the Midas model are divided into six lanes in both directions. The specific lane division is as follows: the two innermost lanes are lane one and lane four, the two outermost lanes are lane three and six, and the two middle lanes are lane two and lane five. Among them, lanes one through three are in the same direction, and lanes four through six are in the same direction.
The time-history analysis function provided by MIDAS can derive the deformations and internal forces of the bridge at any moment in time based on the structural characteristics and applied loads. The research methods are divided into the vibration superposition method and direct integration method. Due to the limitation that the vibration superposition method is only applicable to linear dynamic analysis, the direct integration method, which is widely utilized with small computational volume and high accuracy, is adopted in this paper.
According to the actual traffic situation of the bridge, the dynamic responses of large trucks crossing the bridge are mainly analyzed in this paper, the schematic diagram of the truck is shown in Fig. 2, and the relevant parameters of trucks are shown in Table 1.

Schematic diagram of a tri-axle vehicle.
When the mass of the vehicle is much smaller than the mass of the bridge span, the vehicle can be modeled as a simplified moving load30. Because the tire load is essentially a transient action of the impact load, the triangular load is used to simulate it, shown in Fig. 331, and the principle is to simulate the vehicle in the period of the load gradually increasing to the maximum value F (front-wheel F = 100 kN, middle and rear wheels F = 200 kN) and then decreasing to 0, the specific values of the time t1 and t2 are determined by the speed of the vehicle and the length of the model.

Schematic diagram of triangular loading.
The deck length is 5.3 m for one unit, with a total of 95 units in a single longitudinal row. If the design speed is 80km/h, then t1 = unit length/speed = 5.3 × 3.6/80 = 0.2385 ≈ 0.24s, t2 = 2 × t1 = 0.48 s. The damping ratio of the structure is taken to 0.05, and by the highest order of the self-oscillation period of 0.05 s, the analysis time can be set to be one-tenth of the time step, i.e., 0.005 s. The length of the analysis time as well as the values of t1 and t2 change with the variation of the vehicle speed.
Parametric analysis of bridge vibration responses
Effects of vehicle driving speeds
Moving vehicle load adopts the centralized load simulated by the above method, and travels along the centerline of lane one. From the minimum safe speed (design speed) of 80 km/h for this type of highway bridges, the worst section of the highway bridges must meet the speed of 80 km/h, the minimum speed must not be lower than 60 km/h, and the maximum speed must not be higher than 120 km/h (33.33 m/s)32. To study the dynamic response of highway bridges under different vehicle speeds, the dynamic response of the bridge structures is taken in the range of vehicle speeds from 0 to 36 m/s (129.6 km/h) with 4 m/s increments. The displacement and bending moment responses of the bridge under different vehicle speeds are calculated for static load, 4 m/s, 12 m/s, 20 m/s, 28 m/s and 36 m/s conditions, shown in Fig. 4.

Mid-span’s deflection of deck slab at different driving speeds.
Figure 4 shows the correlation between vehicle position and mid-span deflection at various speeds. The aforementioned image illustrates that the relationship curves are fundamentally same under static loads and speeds of 4, 12, and 36 m/s. At the speed of 20, 28 m/s, there are fluctuations, but the general relationship curve is consistent with the relationship curve at other speeds. The relationship is generally symmetrical. The mid-span deflection initially exhibits a modest upward curvature with the vehicle’s driving position, followed by a quick downward curvature. Upon reaching the mid-span position, the vehicle experiences maximum downwarping at the center span. Subsequently, as it moves past this position, the downwarping value diminishes rapidly, followed by a minor upwarping, ultimately leading to recovery. The mid-span deflection of the arch bridge remains constant regardless of varying vehicle speeds across the bridge deck.
Figure 5 shows the effect of different speeds at the mid-span’s deflection of the bridge deck and its impact coefficient. The mid-span’s deflection of the deck and its impact coefficient are not monotonically increasing or decreasing with the increase in vehicle driving speed, but show a trend of fluctuation after the first flat. When the vehicle speed is from 0 to 16 m/s, the mid-span’s deflection impact coefficient of the deck rises gradually with a weak increment, and the curve is flat. During the period of vehicle speed from 16 to 36 m/s, there are two up-and-down fluctuations, reaching their peak at 20 m/s and 28 m/s, respectively. In single-vehicle low-speed driving, the vehicle on the deck plate span in the impact effect is not big. With the increase of vehicle speed, the impact effect of vehicles on the bridge deck plate increases gradually, and with the fluctuation of the speed interval, the impact effect of vehicles on the bridge deck plate reaches the maximum at the two critical speed points of 20 m/s and 28 m/s.

Maximum deflection and impact coefficient in the Mid-span at different vehicle speeds.
Figures 6 and 7 show the deflection, maximum deflection, and impact coefficients at the L/4 section’s of the deck at different speeds, respectively. The analysis of the figures shows that, like the mid-span’s deflection, the coefficient of influence of the deflection at the L/4 section’s of the deck does not monotonically increase or decrease with increasing speed. When a single vehicle is traveling at a low speed of 0 to 8 m/s, the impact effect of the vehicle on the L/4 section of deck is small and unchanged, and there are two fluctuations in the speed range from 8 to 28 m/s, which reach their peaks at 12 m/s and 24 m/s, respectively. It can be seen that the influence of vehicle speed on the deflection impact effect at the L/4 section of the deck when a single vehicle is traveling is consistent with that of the mid-span, except that the critical speed point of the former occurs earlier than the mid-span, and the value of its critical speed is in the vicinity of 12 m/s or 24 m/s. The difference with the deck at the center of the span is that the deflection impact coefficient at the L/4 section of the deck shows an increasing trend after exceeding the speed of 28 m/s, which is the opposite of the decreasing trend at the mid-span. This indicates that when a single vehicle is traveling at a high speed, the change in the effect of vehicle speed on the deflection of the mid-span and the L/4 section of the deck is opposite.

Deflection of L/4 section of deck slab at different speeds.

Maximum deflection at the L/4 section and its impact coefficient at different vehicle speeds.
Figure 8 represents the moment impact coefficients at the mid-span and L/4 section of the deck at different speeds. Obviously, the bending moment impact coefficient does not increase or decrease monotonously with the increase in vehicle speed, but fluctuates in a certain speed range. The moment impact coefficient at mid-span gradually increases to the peak in the interval from 0 to 20 m/s, then decreases and fluctuates and reaches the second peak at 32 m/s; and the moment impact coefficients at the L/4 section reach the peaks at 8 m/s, 16 m/s, and 32 m/s, respectively. The impact coefficients of the bending moment at mid-span and L/4 section have large difference, and there is no obvious feature with the change of vehicle speed, which indicates that the impact effect of vehicle speed on the bending moment is more complicated. However, the maximum values of the impact coefficient of mid-span’s deflection, mid-span’s bending moment, and L/4 section’s bending moment are 0.069, 0.060, and 0.062, respectively, which are more than the values of 0.05 of the two current specifications, so the current understanding for the impact coefficient of the long span deck type CFST arch bridges are narrow consideration and unsafe.

Moment impact coefficients of critical sections at different vehicle speeds.
Effects of vehicle’s loading on laterally different lanes
The total width of this bridge studied in the paper is 25.5 m with six lanes in both travelling directions. Vehicle loads acting on laterally different lanes will produce different vibrations on the bridge. To study the impact of vehicle eccentric loading conditions on the long span deck type CFST arch bridge, the formulation of different lane loading conditions are chosen. Cases one to three are denoted by a single vehicle loaded along the lane centerline at lane one, lane two and lane three, respectively. The dynamic responses of the bridge are investigated by the different vehicle speeds in the range of 0 to 36 m/s with a 4 m/s increment. The displacement and bending moment responses of the bridge at different vehicle speeds are calculated, and the responses of the bridge under different working conditions when a single vehicle is traveling at a normal speed of 24 m/s, shown in Fig. 9. Figure 9 shows the variation of the deflection at the two key sections of the deck for different working conditions at a vehicle speed of 24 m/s. From the figure, it can be seen that as the vehicle loading lane is farther away from the road centerline, i.e., as the vehicle eccentricity increases, the deflection at the mid-span and L/4 section of the deck decreases.

Deflection response of vehicle’s loading at laterally different lanes at v = 24 m/s.
Figure 10 shows the deflection and impact coefficient of the deck at the mid-span and at the L/4 section’s under different vehicle eccentric loading conditions with the changes of speeds. From the figures can be seen,, the deck and the deflection at the L/4 section and its impact coefficient with the change rule of vehicle speed is basically the same in the three different eccentric load conditions. With the increase of vehicle loading eccentricity, the deflection of the deck decreases, but the impact coefficient increases, indicating that the deflection of the long span deck type CFST arch bridge and its impact coefficient is negatively correlated. That is, the larger the deflection is, the smaller the deflection impact coefficient is. By comparing the deflection diagrams of the mid-span’s and L/4 section’s deflections of the deck, it can be seen that the maximum value of the deflection in the mid-span of the deck decreases by 39.58% from Case one to Case three, while the L/4 section’s deflection decreases by 10.05%, which shows that the influence of the vehicle’s loading eccentricity on the deflection in the mid-span of the deck is much greater than that at the L/4 section. By comparing the deflection impact coefficients at the mid-span and L/4 section, it can be seen that, compared with the deflection impact coefficients at the mid-span of the bridge deck under different conditions, the spacing of the deflection speed-impact coefficient relationship curves at the L/4 section of the deck is smaller, which indicates that the influence of vehicle’s loading eccentricity on the deflection impact coefficients at the mid-span of the deck is larger than that at the L/4 section of the deck.

Influence of vehicle bias loads on the deflection response of deck slab at mid-span and L/4 section.
Figure 11 gives the effects of the vehicle driving in different lanes of eccentricity on the bending moment responses of the main girder at the mid-span and the L/4 section. The changing trend of the moment impact coefficients at the mid-span and L/4 section of the main girder is more or less the same, which fluctuates up and down with the increase in vehicle speeds, but the overall tendency are didferent. With the increase in vehicle eccentricity, the moment impact coefficients at the two key sections increase, but the spacing of the speed-moment impact coefficient curves at the L/4 section is smaller than that at the mid-span, which indicates that the moment impact coefficient at the mid-span is more affected by the vehicle eccentric loading than that at the L/4 section. The trend of the moment impact coefficient in different working conditions is not completely synchronized, which proves again that the influence mechanism of vehicle speeds on the moment impact effects are more complicated.

Influence of vehicle eccentric loading on the bending moment effects of critical sections.
Influence of column stiffness on arch ribs
Columns on arch ribs are the important components of long span deck type CFST arch bridge, the variation of the stiffness of the columns on arch ribs will also have effects on the vehicular vibration. In order to study the dynamic response of long span deck type CFST arch bridge under different stiffness of columns on arch ribs, the original stiffness of the columns is taken as the basis, and 0.6, 0.8, 1.0, 1.2, 1.4 times the column stiffness are taken as different working conditions, and the speed of vehicles are taken as the range from 0 to 36 m/s, and the speeds are incremented by 4 m/s, so that the dynamic responses of the bridge structure are studied. Displacement responses of the bridge under the action of different vehicle speeds are calculated, and the responses of the bridge under the condition of different column stiffness on the arch are shown as follows.
According to the variation trend of the mid-span deflection with different column stiffnesses, the fluctuation of the mid-span’s deflection under different column’s stiffnesses have the same tendency, which fluctuates up and down in the velocity domain from 0 to 16 m/s, and then reaches the peak twice at the critical velocity at 20 m/s and 28 m/s, respectively, and then decreases gently. From the view of different column stiffness conditions, the mid-span’s deflection of the deck is not monotonically increased with the increase of column stiffness, and the mid-span deflection of the deck is significantly higher than that of other conditions under the condition that the column stiffness is 0.6 times the original stiffness, which indicates that the increase of column stiffness can effectively reduce the vibration effect of the mid-span. The mid-span’s deflection decreases further as the column stiffness increases to 0.8 times that of the original stiffness. However, it should be noted that the mid-span deflection is larger at 1.2 and 1.4 times the original stiffness than it was at the original stiffness, and that it is further reduced at 1.4 times the stiffness than it was at 1.2 times the original stiffness. With the increase in stiffness of the columns on arch ribs, the mid-span’s deflection of the deck does not decrease, but increases abruptly when reaching a certain stiffness interval, and then continues to decrease.
From Fig. 12, it is obvious that the impact effects of vehicle load on the mid-span of the deck are the largest at the critical speed points at 20 m/s and 28 m/s. When the column stiffness of 0.6 times the original stiffness is increased to 0.8 times the original stiffness, the peak of the mid-span’s deflection impact coefficient increases, because of the increase of column stiffness, but its static effect decreases more, so the overall impact effect increases instead. With the further increase in stiffness, the original stiffness peak of 1.2 times, 1.4 times the impact coefficient in 20 m/s is higher than the original stiffness peak, in 28 m/s is lower than the original stiffness peak. The change rule of the mid-span’s deflection of the deck is consistent with the increase of the column stiffness, the impact effect is not a single increase. But when the column stiffness increasing to a certain value, it will be a sudden change, the impact effect is obviously weakened, and then continue to increase.

Effect of column stiffness on mid-span deflection and impact coefficient of bridge deck slabs.
From Fig. 13, it can be seen that the trends of the L/4 section’s deflections with vehicle speed under different column stiffness conditions are generally the same. Unlike the mid-span deflection, the peak of the L/4 section arrives earlier than the critical speed points of 12 m/s and 24 m/s, and the change amplitude of the deflection is smaller, compared to the mid-span’s deflection of the deck. Under the same stiffness condition, the maximum difference of the mid-span’s deflection is 0.64 mm, which is 3.37 times the maximum difference of the L/4 section’s deflection of 0.19 mm, indicating that the mid-span’s deflection is more affected by the vehicle speed than the L/4 section’s deflection. Under the same speed condition, the maximum difference of the mid-span’s deflection is 1.78 mm, which is 1.21 times the maximum difference of the L/4 section’s deflection of 1.47 mm, indicating that the mid-span’s deflection is more sensitive to the stiffness change of the columns than the L/4 section’s deflection. It is worth noting that the L/4 section’s deflections gradually decrease with the increase of column stiffness under different column stiffness conditions, and there is no sudden change in the mid-span’s deflections.

Influence of column stiffness on deflection and impact coefficient of deck slab at quarter points.
The maximum value of the impact coefficient of mid-span’s deflection under the same stiffness condition is 0.64, which is 3.37 times of the maximum value of the impact coefficient of the L/4 section’s deflection of 0.19, which indicates that the mid-span’s position is more affected by the speed of the vehicle compared with the L/4 section’s deflection,. The maximum value of the mid-span’s deflection influence coefficient is 1.91 times the maximum value of the L/4 section’s deflection influence coefficient for the same velocity, which indicates that the mid-span’s location of the deck is more sensitive to the stiffness change of the columns compared to the L/4 section location. From the overall point of view, the maximum value of the deflection impact coefficients at the L/4 section is located at 36 m/s with a value of 0.27 at 0.6 times the original stiffness, while the maximum value of the deflection impact coefficient at the mid-span is located at 28 m/s with a value of 0.64 at 0.6 times the original stiffness, which is 2.37 times of the former. Macroscopically speaking, the impact effects of the vehicle load on the deck of the long span deck type CFST arch bridge at the mid-span is much greater than that at the L/4 section.
Analysis of the local dynamic responses of the bridge
Each dynamic impact coefficients of a bridge in bridge design aew always based on the overall dynamic responses of the bridges, which is generally the deflection or strain in the bridge, and such impact coefficients are determined based on the overall dynamic responses of the bridge are applied to the design of each component of the bridge. However, the structural system, the type of cross-section, the variety of construction materials, and the different members of the bridge mean that the impact effects of the vehicle loads from the impacts of the bridge is very different, as the current generalized specification of the bridge set by the overall impact coefficient are not enough, and need to be further tested. In contrast, the local impact effect happens to represent the impact effect on a single component of the bridge, which can make up for the deficiency of the norm set by the overall impact effect. In Wang33 used a similar method in this paper to study the impact coefficient of local components of long span suspension bridges, which proved the reliability of the research method. In this paper, the local impact effect of long span concrete-filled steel tube arch bridge components was carried out.
Effects on columns on arches at different vehiclels travel speeds
As one of the key components of load-bearing of long span deck type CFST arch bridges, the columns on the arch ribs not only have to transfer all the loads on the deck and main girders to the arch ribs, but also play the role of connecting the main girders with the arch ribs. As the most prone to damage, the vibration mechanism of the columns is also more complex, so it is necessary to study the local dynamic response of the columns on the arch, which is of great significance for the subsequent fatigue detection and damage assessment of the columns. Especially for the world’s longest deck type CFST arch bridge(Wujiang bridge), it has a total of 14 columns, with the tallest column as high as 78.975 m. In this section, the end columns near the junction piers, the middle columns at the L/4 section, and the top columns at the vault are selected as the key local research components of the bridge, and the speed is taken as the range from 0 to 36 m/s, and the local dynamic response of the bridge is investigated by a single vehicle loaded on the lane with a speed increment of 4 m/s. The top, middle, and top columns have a cross-section of 2500 × 1200 mm2, 2500 × 1500 mm2, 2500 × 2000 mm2, and 2500 × 1500 mm2, respectively.
Figure 14 shows the longitudinal and transverse displacement impact coefficients of the top columns, center columns, and end columns. impact coefficient of the transverse displacement of the top column fluctuates up and down in the velocity range from 0 to 24 m/s with little change, and then rises steeply after exceeding the critical velocity of 24 m/s, and finally has a leveling trend at 36 m/s. Change rule of the transverse displacement impact coefficient of the end column is similar to that of the top column, which fluctuates gently up and down in the velocity range from 0 to 12 m/s, rises steeply after exceeding the critical velocity of 12 m/s, and rises gently after the velocity of 20 m/s. The change rule of the lateral displacement impact coefficient of the central column is more complicated, fluctuating up and down throughout the velocity interval from 0 to 36 m/s, and reaching the maximum value at 4 m/s and 20 m/s. The maximum impact coefficient of the top column, middle column, and end column reached the maximum value at 36 m/s, 20 m/s, and 36 m/s, which are 0.138, 0.142, and 0.426, respectively, and the amplitude of the maximum impact coefficient of end column is 3.09 times that of top column and 3 times that of middle column.
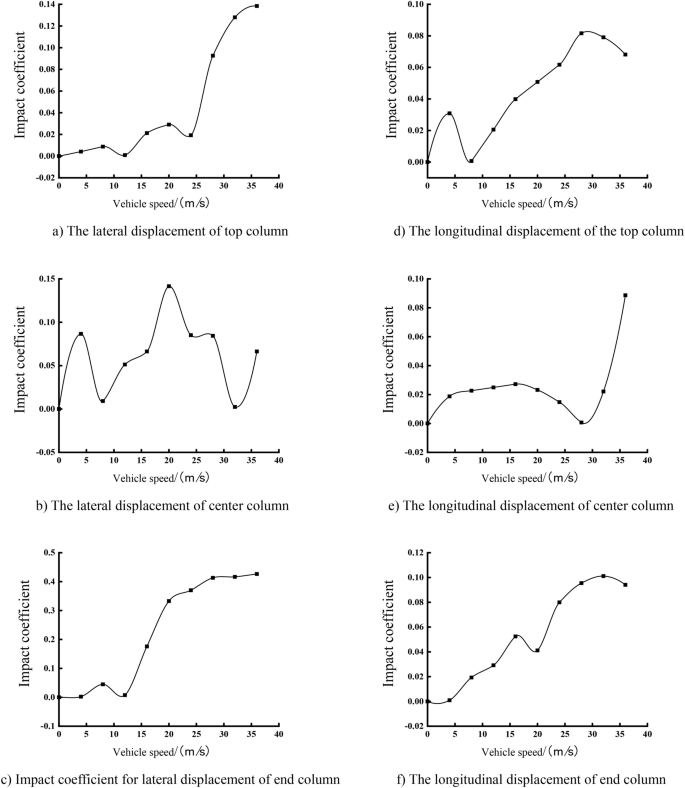
Curve of impact coefficients of transverse and longitudinal displacement of each column with different speeds.
The features of the relationship between the longitudinal displacement impact coefficients of each column with vehicle speed, the longitudinal displacement of the top column and the end column shows an overall increasing trend with the increase of vehicle speed, and the central column increases and then decreases in the speed domain from 0 to 28 m/s, and then increases steeply and reaches the peak value at 36 m/s. The peak longitudinal displacement impact coefficient of the end column is 0.101, which is 1.23 times that of the top column and 1.13 times that of the center column, respectively.
By analyzing the displacements of the columns in Fig. 15, it can be seen that the impact coefficients of the transverse and longitudinal displacements of the top and middle columns fluctuate in the range of 0 to 0.15 under the action of different vehicle speeds, while the impact coefficients of the transverse displacements of the end columns are as high as 0.426 under high-speed conditions. In terms of longitudinal displacement, the top column and the end column converge and rise gently, while the impact coefficient of the middle column is only gradually close to that of the top and end columns at high speeds after 28 m/s. The speed of impact coefficients of the transverse and longitudinal displacement of each column does not differ much, but the transverse and longitudinal displacement of end column is higher than that of top and center columns, especially end column in the transverse displacement of the impact mostly is effected by speeds. Compared with the other two columns, the larger and taller cross-section sizes of the end columns of the bridge are, transverse stiffness is smaller.

Curves of impact coefficients of transverse and longitudinal displacement of each column with different vehicle speeds.
From the Fig. 16, each column of the changing trend is generally the same, and fluctuations in the speed point are the same. However, the end column because of its paraxial cross-section size is larger, height is higher, and column stiffness and frequency are smaller, so in the impact of the vehicle load by the impact effect is greater, its stress impact coefficient amplitude for the top and the center of the 2.45 times, 3 times. The impact coefficient of the bridge as a whole is smaller than the impact coefficient of each column in the velocity range from 0 to 12 m/s, and larger than the impact coefficient of each column in the velocity range from 16 to 36 m/s, but still smaller than the stress impact coefficients of the end columns at the velocity points of 16 m/s, 24 m/s, and 36 m/s. Therefore, it is unreasonable to simply use a bridge’s overall impact coefficient to reflect the impact coefficient of vehicle loads on different local components, and the impact coefficients matching the components should be selected, according to the different local components of the bridge and the design requirements34.

Relation curve of stress impact coefficient of each column with vehicle speed.
Effect of vehicle eccentric loading on arch ribs
To further explore the influence of vehicle eccentric loading on the impact coefficient of the local components of the bridge, the top of the main arch and the L/4 section of the main arch are selected as the research object, and the working conditions one two three are formulated as a single vehicle loaded at the one, two or three lanes, taking the speeds of the vehicle as the range of 0 to 36 m/s, and the velocity is incremented by 4 m/s, to study the local response of the bridge under different working conditions. Among them, the transverse displacements of one, two, three lanes are 3.38 m, 0.37 m, and 3.85 m. Lane one is located on the inner side of the arch ribs and lanes two and three are located on the outer side of the arch ribs.
From the Fig. 17, each impact coefficient with the speed change in the relationship curves can be seen: the torque impact coefficient of the vault of the changes with the speed and the spacing is the largest, and the maximum difference between the impact coefficients of the various conditions is 0.146 at the speed of 32m/s. The lane eccentric loading on the vault’s torque impact coefficient is obvious, and the impact coefficient of the various impact coefficients is not simply positively correlated to the increasing distance and the increase of the eccentricity. In the transverse displacement of the vault, the trend of each condition is synchronized, and the two and three curves basically coincide, and the amplitude of the peak and troughness of condition one is always larger than that of the other two conditions. The three curves reach the peaks at the critical velocity points 12m/s and 24m/s, and reach the maximum value at 36m/s, and coincide basically. The greatest influence of eccentric distance of th vehicle on the impact factor of lateral displacement is the location of arch ribs, followed by the eccentric distance between the vehicle and arch ribs. Similarly, Case one which is on the inside of arch ribs, is subjected to the smallest impact coefficient of bending moment, followed by Case two, which is located closer to the outside of arch ribs. In the torque impact coefficient figure, the influence of condition one on the torque impact coefficient is greater than that of the other two conditions at low speeds, and the trend of the three condition curves is gradually approaching as the vehicle speed continues to increase. Therefore, the greatest influence of eccentric vehicle load on the local impact coefficient of arch ribs is the positional relationship between the lane and arch ribs, followed by the lateral distance from arch ribs.

Curves of each impact coefficients of the vault under different vehicle speeds.
From the Fig. 18, it can be seen: the overall trend of the lateral displacement of the 1/4 section of main ribs is the same to that of the mid-span, but in more than 28m/s critical speed point began to decline as a whole, compared to the top of the main arch, so that the lateral displacement of the 1/4 section of main ribs reaches a maximum of the speed of the critical point in advance of the speed of the mid-span. In the change curves of the bending moment at 1/4 section of main ribs, the impact coefficient of bending moment of condition one is always larger than that of the other two conditions in the velocity domain from 0 to 28m/s. Beyond the critical velocity point of 28m/s, condition two or three begin to rise steeply, which is much larger than that of the impact coefficient of condition one, and the maximum difference of the impact coefficient is 0.115. In terms of torque, the curve trend of Case one, which is on the outside of the arch rib, is also very different from that of the other two cases, and the impact coefficient of Case one is always larger than that of Case two or three in the velocity domain from 0 to 16m/s, with a maximum difference of 0.081. The impact coefficient of Case one is smaller than that of Case two or three in the velocity domain from 16 to 36m/s, with a maximum difference of 0.236. Under different vehicle loading conditions, it is the torque that has the greatest effect on the local impact coefficients at the 1/4 section of main ribs, and for the same local member parameter, the gap between the vehicle loading position relative to the position of the arch ribs has the greatest effect on the impact effect, followed by the effect of the eccentric distance.

Curves of each impact coefficient at 1/4 of the main arch as a function of vehicle speed.
Influence of column stiffness on arch ribs
As the columns connected between the main girder and the arch ribs, the important role of the columns on the arch is self-evident. Based on the original model, the 0.6, 0.8, 1.0, 1.2, 1.4 times the column stiffness for different working conditions are taken, respectively, and the speeds of the vehicle for the range of 0 to 36 m/s are taken, and the velocity of the vehicle is increased by 4 m/s, to study the dynamic responses of the local bridge structure. The displacement and stress responses of the bridge under different speeds are calculated, and the local responses of the bridge under different column stiffnesses on the arch are showed as follows.
From the overall view of the features of lateral displacement, bending moment, and torque impact coefficient of the vault with vehicle speeds, the spacing of the curves in the feature of bending moment impact coefficients of the vault with vehicle speed is relatively smallest, so the changes of column stiffness have the smallest impact on the bending moment of the vault, compared with the lateral displacement and the torque. In Fig. 19a, except for individual velocities, the lateral displacement impact coefficient gradually decreases in the process of increasing the column stiffness from 0.6 times the original stiffness to 1.4 times the original stiffness in the whole range of velocities from 0 to 36m/s, which indicates that the lateral impact effect of the vehicle load at the vault is getting smaller and smaller with the increase of column stiffness. The reduction of the maximum dynamic effect at the main vault caused by the increase of column stiffness is larger than the reduction of the maximum static effect, thus showing an overall trend of becoming smaller and smaller. In Fig. 19b, the moment impact coefficients of the vaults under different column stiffness conditions reach the peak at the critical velocity of 20 m/s and then fluctuate discretely after exceeding 24 m/s. According to the comparison, like the mid-span deflection impact coefficient, the vault’s moment impact coefficient increases with the increase of column stiffness, but when it reaches a certain value of column stiffness, there will be a sudden change, resulting in a sudden decrease of the impact coefficient, and then continue to rise. In Fig. 19c, because of the many factors affecting the vault’s torque, the curves under the conditions of each column stiffness are relatively discrete and have no obvious regularity, but their undulating and fluctuating trends remain generally consistent. From the perspective of different column stiffness, the vault’s torque impact coefficient decreases with the increase of column stiffness, indicating that the vault’s torque under the influence of column stiffness, the maximum dynamic effect of the reduction is greater than the maximum static effect of the reduction, and thus subject to vibration effect is getting smaller and smaller. However, the impact coefficients of the torque at the vault are lower than the rest of the column stiffnesses throughout the velocity interval at 0.6 times the column stiffness, which may be the increment of the maximum static response of the torque at the vault is much larger than the increment of the maximum dynamic response at this condition, compared with the other stiffnesses, which reflects a lower impact coefficient overall.

Curves of each impact coefficient of the main vault as a function of vehicle speed.
From the overall view, the maximum value of the impact coefficient of transverse displacement of the vault is located at 32 m/s under the condition of 0.6 times the original stiffness, and its value is 0.26. The maximum value of the impact coefficient of the bending moment of the vault is located at 20 m/s under the condition of 0.8 times the original stiffness, and its value is 0.06. The maximum value of the impact coefficient of the torque of the vault is located at 24 m/s under the condition of 0.8 times the original stiffness, and its value is 0.26. The maximum impact coefficient of transverse displacement and torque of the vault are both 4.3 times of the impact coefficient of bending moment. From a macroscopic point of view, the transverse impact effect of the vehicle load at the arch ribs of a top-loaded arch bridge is much larger than the longitudinal impact effect.
Compared with the above three figures, impact coefficient of the bending moment at 1/4 section of arch ribs is not sensitive to the change of the column stiffness relative to the transverse displacement and the torque at 1/4 of arch ribs. For Fig. 20a, it is not difficult to find that the curves under 0.6 times the original stiffness conditions are more discrete, unstable, and fluctuating compared with other curves. In the low-speed range from 0 to 8 m/s, there is not much difference between the stiffness curves, and in the medium-speed range from 8 to 24 m/s, the transverse displacement’s impact coefficient at 1/4 section of arch ribs decreases with the increase of column stiffness, which indicates that the impact effect on the transverse direction of 1/4 section of arch ribs is gradually reduced, but in the high-speed range from 24 to 36 m/s, the transverse displacement impact coefficient at 1/4 section of arch ribs changes with the stiffness of the column with no obvious pattern. In Fig. 20b, except for the 0.6 times original stiffness curves, the rest of the curves can keep fit, and the same undulation trend and the magnitude of the moment impact coefficient between the curves are very small. The reason may be 0.6 times the original column stiffness is too low, resulting in the column as a whole partial flexibility and instability, which in turn amplifies the impact effect caused by vehicle vibration when the vehicle load over the bridge. Therefore, too low stiffness should be avoided in the design of column parameters. From Fig. 20c, the same speed condition or the same stiffness condition of the torque impact coefficient with the change of the speed is not obvious, which indicates that there are many factors affecting the torque of 1/4 section of arch ribs, because the stiffness of the column and the driving speed is not enough to generalize the change of the impact effect of the vehicular loads.

Curves of each impact coefficient at 1/4 section of arch ribs.
From the overall view, the maximum value of the lateral displacement impact coefficient at the 1/4 section of arch ribs is located at 20m/s under the condition of 0.6 times the original stiffness, and its value is 0.39. The maximum value of the bending moment’s impact coefficient at the 1/4 section of arch ribs is located at 20m/s under the condition of 0.6 times the original stiffness, and its value is 0.20. The maximum value of the torque’s impact coefficient at the 1/4 section of arch ribs is located at 4m/s under the condition of 1.2 times the original stiffness, and its value is 0.19. The torque’s impact coefficient at the 1/4 section of arch ribs is 1.95 times the original stiffness. At the macroscopic level, like the main arch, the transverse impact effect of the vehicle load at the 1/4 section of arch ribs of the deck type CFST arch bridge is much larger than its longitudinal impact effect, but the difference of its longitudinal and transverse impact effects is smaller than that of the longitudinal and transverse impact effects at arch ribs.
Conclusion and outlook
Conclusion
In this paper, the dynamic impact coefficients of deck type CFST arch bridges are introduced, and the vibration responses of arch bridge under the action of a single vehicle, as well as the dynamic response of the local components of the longest deck type CSFT arch bridge in the world up to now are analyzed by the FEM, and the main conclusions are obtained in the following.
-
(1)
The critical velocity of the deflection at the L/4 section of the deck appears earlier than that at the mid-span, and the vertical impact effect of the deck at the mid-span is more intense than that at the L/4 section. There is not much difference in the longitudinal vibration response of the main girder at the mid-span and the L/4 section of the main girder due to the vehicle loading.
-
(2)
With the increase of vehicle’s loading eccentricity, the deflection of the deck is negatively correlated with the change of its impact coefficient. The larger the deflection is, the smaller the deflection impact coefficient is. The vertical and longitudinal impact effects of vehicle eccentric loading on the deck at the mid-span are larger than those of the L/4 section of the deck.
-
(3)
The vertical vibration response at the mid-span of the deck does not decrease monotonically with the increase of column stiffness, but increases abruptly when reaching a certain stiffness interval. The deflection at the L/4 section of the deck decreases monotonically with the increase of column stiffness, and the vertical vibration at the mid-span is more sensitive to the change of column stiffness than of the L/4 section of the deck.
-
(4)
The vertical, longitudinal, and transverse impact effects of the end column are much larger than those of the other two columns, and the vibration response in the transverse direction is the most sensitive to the speed of the vehicle. Therefore, it is unreasonable to use the overall impact coefficient of the bridge to reflect the impact effect of the vehicular load on the local bridge members, and the impact coefficients, according to the different local members of the bridge, need to choose the impact coefficients.
-
(5)
Eccentric loading of the lane has the greatest effect on the torque impact coefficient of arch ribs; the greatest effect on the impact coefficient of transverse displacement under eccentric loading of the vehicle is the position of arch ribs, followed by the eccentric distance between the vehicle and arch ribs. The greatest effect on the local impact coefficients of the mid-span and the L/4 section at arch ribs under eccentric loading of the vehicle is the positional relationship between the lane and arch ribs, followed by the effect of the eccentric distance.
-
(6)
The transverse impact effect of vehicle load on the mid-span and L/4 section of arch ribs is much larger than the longitudinal impact effect, but the difference between the longitudinal and transverse impact effects on the L/4 section of arch ribs is smaller than that on the top of arch ribs. The transverse impact effect on the top of the mid-span and L/4 section of arch ribs is much more sensitive to the changes in the stiffness of the columns than that in the longitudinal impact effect.
Outlook
This paper presents a systematic analysis of the coupled vibration response of the Wujiang Bridge, the world’s longest span deck type CFST arch bridge, elucidating the dynamic characteristics of both the entire structure and its local components, as well as the variation of the impact coefficient under vehicular loading. Despite the significant conclusions reached by the advanced finite element model and parametric analysis, several limits persist that require enhancement, indicating avenues for future research.
-
(1)
This research examines the dynamic reaction to single truck loading, although the parallel or sequential behavior of multiple vehicles in actual traffic may result in more intricate vibration superposition effects. Future research may include traffic flow models to examine the cumulative impacts of multi-vehicle interactions on the overall and localized impact coefficients of bridges.
-
(2)
The current model utilizes tri-axle truck parameters, and future iterations may include various vehicle types (e.g., passenger cars, overweight trucks) to investigate the distinct impacts of their mass distribution and wheelbase variations on bridge dynamic responses, thereby offering more comprehensive data support for specification revisions.
-
(3)
The parameters for vehicle speed (0 to 36 m/s) and deflection distance in this study do not encompass extreme conditions (e.g., ultra-high speeds or significant deflections), potentially leading to an underestimation of dynamic impacts in some high-risk situations. Future research may examine the dynamic effects in harsh situations.
Data availability
All data generated or analyzed during this study are included in this article. All data included in this study are available upon request by contact with the corresponding author.
References
Ju, B. Z. Damage Diagnosis Study for RC Simply Supported Girder Bridges Based on Vehicle-Bridge Coupled Vibration (Harbin Institute of Technology, 2015).
Xia, H. & Zhang, N. Dynamic Interaction of Vehicles and Structures 2nd edn. (Science Press, 2005).
Yu, H. R., Lu, N. W. & Liu, Y. The probability of vehicle-effect extreme value of existing arch bridges with continuous increase of traffic volume. J. Transp. Sci. Eng. 36(1), 50–55 (2020).
Li, X. Z., Zhang, L. M. & Zhang, J. State-of-the-art review and trend of studies on coupling vibration for vehicle and highway bridge system. Eng. Mech. 26(3), 230–240 (2008).
Wang, G. C. & Li, W. S. The analysis on the vehicle ride comfort based on vehicle-bridge coupled vibration. J. Vib. Shock 35(8), 224–230 (2016).
Mohammed, A. M., Alamnsour, H. H. & Martin-Perez, B. Evaluation of dynamic deformation of slab-on-girder bridge under moving trucks with corrosion-damaged columns. Eng. Struct. 66, 159–172 (2014).
Ding, Y., Zhang, W. & Au, F. T. K. Effect of dynamic impactat modular bridge expansion joints on bridge design. Eng. Struct. 127, 645–662 (2016).
Moghimi, H. & Ronagh, H. R. Impact factors for a composite steel bridge using non-linear dynamic simulation. Int. J. Impact Eng 35, 1228–1243 (2008).
Bruno, D., Greco, F. & Lonetti, P. Dynamic impact analysis of long span cable-stayed bridges under moving loads. Eng. Struct. 30, 1160–1177 (2008).
Jiang, P. W. Coupled Vibration Between Vehicles and Highway Long-Span Continuous Series bridge (Chang ’an University, 2012).
Ma, H. L. Study on coupling vibration impact effect of curved steel-mixed box girder bridge. Transp. World 19, 118–120 (2024).
Cao, H. T., Lu, Y. & Chen, D. Analysis of vehicle-bridge coupling vibration characteristics of curved girder bridges. Appl. Sci. Basel 14(5), 2021 (2024).
Shao, Y. Research on Safety and Durability of Arch Bridge Suspender System Considering Vehicle-Bridge Coupling (Dalian Maritime University, 2017).
Li, Z. Analysis of Coupled Vibration Response and Sensitivity of Cable-Stayed Bridge with short Tower (Anhui University of Civil Engineering and Architecture, 2024).
Zeng, Y. et al. Dynamic responses of long-span steel truss girder cable-stayed bridge with a single pylon. Adv. Civil Eng. https://doi.org/10.1155/adce/8136402 (2025).
Zhao, L. W. et al. The analysis of impact factor on concrete filled steel tubular arch bridge with long span. Struct. Eng. 35(02), 14–20 (2019).
Hou, J. L. et al. Typical diseases of a long-span concrete-filled steel tubular arch bridge and their effects on vehicle-induced dynamic response. Front. Struct. Civ. Eng. 14(4), 867–887 (2020).
Yao, D. R. & Deng, N. C. Vehicle-bridge coupling vibration analysis of long-span concrete-filled steel tubular arch bridge. J. Railw. Sci. Eng. 19(12), 3693–3704 (2022).
Hu, W. L., Zhou, B. & Zheng, X. B. Fatigue evaluation of CFST arch bridge based on vehicle-bridge coupling vibration analysis. Buildings 14(6), 1787–1787 (2024).
Jiang, Z. H. Vehicle-bridge coupling vibration analysis of upload concrete-filled steel tube arch bridge. Constr. Design Proj. 01, 125–127 (2025).
Yu, Q. H. & Gao, Q. S. Dynamic response analysis of deck-type concrete-filled steel tubular arch bridge. J. Transp. Sci. Eng. 40(06), 1–8 (2024).
Wang, W. Study on the Fatigue of Seel-Concrete Composite Bridges Based on Vehicle-Bridge Coupled Vibration (Hunan University, 2017).
Zhu, Q. J., Xiao, Q. & Deng, L. Dynamic weighing method of bridge based on bearing reaction force. J. China Foreign Highw. 39(01), 87–94 (2019).
Leitao, P. N. et al. Composite (steel-concrete) highway bridge fatigue assessment. J. Constr. Steel Res. 67(1), 14–24 (2011).
Li, L. Y. Research on the Dynamical Response of the Vehicle-Road-Rigid Coupling of Curved Bridge Based on UM (Shijiazhuang Railway University, 2020).
General Administration of Quality Supervision, Inspection and Quarantine of the People’s Republic of China, Standardization Administration of China. GB/T 7031–2005, Mechanical Vibration Road surface spectrum measurement data Report. (China Quality Inspection Press, 2005).
Sun, B. C. Research on the Impact Coefficient of the Through Concrete-Filled Steel Tube Arch Bridge Based on the Vehicle-Bridge Coupled Vibration (East China Jiaotong University, 2017).
Xia, H., Xu, H. & Yu, Y. J. Main bridge design of Wujiang River Bridge of Dejiang-Yuqing expressway. World Br. 51(05), 14–21 (2023).
Hu, L. F. Study on Nonlinear Stability and Simplified Calculation Method of Super Long-Span Deck Concrete-Filled Steel Tube Arch Bridge (Chongqing Jiaotong University, 2022).
Wang, S. Q., Yue, Z. R. & Ma, Q. A simulation study of vehicles dynamic effects on bridges. J. Shijiazhuang Railw. Instit. 03, 47–51 (2005).
Shen, M., Lin, X. F. & Liu, D. G. Analysis of simple vehicle-bridge coupled vibrations based on Midas Civil. Western Transp. Sci. Technol. 61(08), 68–71 (2012).
Liu, G. J. Analysis on the Coupled Vibration of Vehicle-Bridge for Highway Curved Girder Bridge (Harbin Institute of Technology, 2017).
Wang, F. X. Research on the Dynamic Impact Factor of Local Components of Large-Span Suspension Bridge (Chongqing Jiaotong University, 2022).
Chen, X. Dynaminc Response Analysis of Shelijia Bridge Under Vehicle Moving Loads (East China Jiaotong University, 2021).
Acknowledgements
The supports of the National Natural Science Foundation of China (Grant No. 52478139), Chongqing Overseas Returnees Entrepreneurship and Innovation Support Fund (Grant No. cx2018113, cx2020117), Scientific and Technological Research Program of Chongqing Municipal Education Commission (Grant No.KJZD-K202300702), Chongqing Natural Science Foundation (Grant No.2024NSCQ-MSX2566), and National Key R&D Program Fund (Grant No. 2022YFB2302501-3) are greatly appreciated.
Author information
Authors and Affiliations
Contributions
Conceptualization, Yong Zeng; Data curation, Nianchuan Yin; Investigation, Yujie Tan; Resources, Shihao Qi and Yujie Tan; Writing—review and editing, Yong Zeng, Nianchuan Yin, Hongmei Tan. All authors have read and agreed to the published version of the manuscript.
Corresponding author
Ethics declarations
Competing interests
The authors declare no competing interests.
Additional information
Publisher’s note
Springer Nature remains neutral with regard to jurisdictional claims in published maps and institutional affiliations.
Rights and permissions
Open Access This article is licensed under a Creative Commons Attribution-NonCommercial-NoDerivatives 4.0 International License, which permits any non-commercial use, sharing, distribution and reproduction in any medium or format, as long as you give appropriate credit to the original author(s) and the source, provide a link to the Creative Commons licence, and indicate if you modified the licensed material. You do not have permission under this licence to share adapted material derived from this article or parts of it. The images or other third party material in this article are included in the article’s Creative Commons licence, unless indicated otherwise in a credit line to the material. If material is not included in the article’s Creative Commons licence and your intended use is not permitted by statutory regulation or exceeds the permitted use, you will need to obtain permission directly from the copyright holder. To view a copy of this licence, visit http://creativecommons.org/licenses/by-nc-nd/4.0/.
About this article

Cite this article
Zeng, Y., Yin, N., Tan, Y. et al. Study on dynamic responses and impact factors of long span deck type CFST arch bridge under vehicle loads. Sci Rep 15, 16666 (2025). https://doi.org/10.1038/s41598-025-99530-7
Received:
Accepted:
Published:
DOI: https://doi.org/10.1038/s41598-025-99530-7
