


Abstract
Hydrogen (H) retention and desorption in tungsten (W)-based plasma-facing materials are still not well understood, largely due to the limitations of ex-situ observations in experimental detection methods like thermal desorption spectroscopy (TDS). In order to reveal the fundamental mechanisms behind H retention and desorption, we developed a cluster dynamics model, IRadMat-TDS, for theoretical modeling of depth distribution and TDS of deuterium (D) in polycrystalline W. The model newly includes the saturated absorption and emission of D in inherent sinks like grain boundaries (GBs), as well as the multi-trapping effect of D in various types of GBs with different trapping energies. The simulated TDS spectra are in agreement with experimental ones. For polycrystalline W under D ion irradiation within keV-energy range, two typical thermal desorption peaks in TDS at around 490 and 550 K are explicitly attributed to D emission from GBs and vacancies, respectively. And GBs play a major role in D retention. Moreover, the broad peaks in TDS come from the convolution of multi-trapping of D in sinks with different types of trapping sites rather than a single-site approximation.

Original content from this work may be used under the terms of the Creative Commons Attribution 4.0 license. Any further distribution of this work must maintain attribution to the author(s) and the title of the work, journal citation and DOI.
1. Introduction
The selection of plasma-facing materials (PFMs) exposed to high heat load and energetic particle flux is crucial for the development of nuclear fusion reactors [1]. Tungsten (W) has been regarded as one of the most promising candidates for PFMs due to its high melting point, high thermal conductivity and low erosion rate [2, 3]. However, W also has some negative features such as high atomic number Z, high ductile-brittle transition temperature, and low recrystallization temperature [4, 5]. The main concern is that fusion fuels, hydrogen (H) isotopes, can be easily trapped by both inherent and irradiation-induced defects in W, which greatly enhances H retention and thus poses nuclear safety risks and hinders fuel cycle sustainability [6]. Therefore, understanding the microscopic mechanisms of H retention and desorption is always a key issue in W-based PFMs.
Over the past decades, extensive experiments have been performed to study H behaviors in W. Due to the lack of accessible 14.1 MeV neutron sources and the radioactivity problems resulting from neutron and tritium (T) irradiation, heavy ions and deuterium (D) ions are typically used as proxies to investigate the synergistic radiation effects of fusion plasma [7–10]. Common detection methods are usually employed to characterize H effects in irradiated W materials, including Rutherford backscattering spectrum, nuclear reaction analysis, thermal desorption spectroscopy (TDS), and so on. Among these techniques, TDS is widely applied to assess H retention and desorption behaviors in W, during which H release is detected as a function of temperature by a quadrupole mass spectrometer. Generally, TDS measurements are straightforward and can provide not only the total amount of retained H but also the characterized desorption peaks associated with possible defects in materials [11]. However, TDS still has the following limitations: (1) it cannot detect the detailed depth or size distribution of retained H. (2) It is difficult to assign a specific desorption peak to a particular trapping site due to the overlapping contribution from multiple traps. (3) The analysis of TDS still shows great uncertainty due to the variety of irradiation conditions and material properties, as well as the lack of complete understanding of H behaviors in W. For instance, the low temperature desorption peaks at 300–700 K under varying irradiation conditions are often attributed to H capture by low-temperature traps [12–15]. However, the specific types of traps and their respective contributions to TDS remain unclear. Therefore, experimental TDS characterizations can hardly provide direct or conclusive information about the mechanisms responsible for H retention in W. In such cases, theoretical simulations of TDS are necessary to complement the experimental findings and gain further insights into H behaviors in W.
Given the remarkable range of spatial (nm–m) and time (ps–years) scales of radiation damage [4, 16], no single modeling tool can provide a complete and systematic description of all the involved H behaviors, including implantation, diffusion, trapping, desorption and so forth. Mesoscale models are recommended as feasible methods for studying H retention and desorption, such as object kinetic Monte Carlo (OKMC), cluster dynamics (CD), diffusion-trapping (DT) and so on. OKMC can predict the spatial evolution of defect clusters through a sequence of states connected by random events [17, 18]. Although OKMC includes spatial correlations between defects, its computational complexity makes it difficult to apply to large-scale and long-time systems [18]. The DT model is a simple yet efficient phenomenological model for the study of TDS [19]. However, the accuracy of this model relies on certain artificial approximations, such as unrealistic trap concentrations [20] and uncertain calculations of trapping and de-trapping rates [13]. Moreover, due to the neglect of most microscopic defect dynamics, the DT model fails to offer detailed information about the interactions between defects and the mechanisms of H retention.
In contrast, the CD model, based on the mean-field rate theory [21, 22], has emerged as a favorable approach to simulate H retention and desorption under various irradiation conditions. The so-called mean-field approximation results in significant computational gains for the CD model. Additionally, the complete energy barrier/bonds of defects in W have been widely and accurately obtained by atomistic methods like density functional theory (DFT) and molecular dynamics (MD) [23]. Leveraging its mean-field nature and atomistic parametrizations, the CD model can effectively handle large-scale and long-term defect evolution to determine the concentrations of defect clusters, through solving a large number of coupled partial differential equations (PDEs) [24]. Recently, Yu et al proposed a spatially resolved stochastic CD model for TDS analysis of pre-damaged W samples [25]. While it reduces the number of equations by randomly selecting defect types and reaction events, it may compromise precision, especially for low-concentration defect clusters. We have previously developed a deterministic CD model, IRadMat [26–28], and successfully applied it in both ion-implanted and neutron-irradiated W systems with high computational efficiency and accuracy. However, the model overestimates H absorption and neglects H emission in inherent sinks, particularly polymorphic grain boundaries (GBs), leading to its limitations in simulating and calibrating TDS. It is thus necessary to improve the CD model to further investigate the impact of the saturated absorption and multi-trapping effect of polymorphic GBs on H retention and desorption.
In this work, we present an enhanced CD model for simulating TDS by incorporating the saturated absorption and emission processes as well as the multi-trapping effect of H in inherent sinks like GBs. The experimental TDS results of polycrystalline W after D implantation are accurately reproduced with this improved CD model. This approach enables effective calibration of desorption peaks corresponding to specific defects, providing valuable insights into the underlying mechanisms of H retention and desorption in polycrystalline W.
2. Computational methods
To establish a fundamental correlation between microscopic retention mechanisms and macroscopic desorption phenomena, a CD model named IRadMat-TDS has been developed for systematically simulating TDS of H in W. The framework of IRadMat-TDS is illustrated in figure 1. Quantitative simulations of TDS necessitate reproducing the linear heating process and accurately describing the interactions between H and various microstructures. Our previous CD model, IRadMat [28], successfully employed a set of diffusion-reaction master equations to describe the evolution of microstructures in terms of size, depth, and time at a constant irradiation temperature. IRadMat-TDS has been updated by incorporating an effective high-temperature annealing module to simulate the defect evolution with increasing temperature. In addition, to provide a more realistic description of H behaviors, we have expanded the model to include complex interactions among various defects. In the following, we will briefly introduce IRadMat-TDS, including the basic theory of the CD model, improvements in the reaction and sink terms, and the simulation procedure for TDS.

Figure 1. The framework of IRadMat-TDS: (a) potential diagram of W-H system. (b) TDS spectrum. (c) The improved CD model. (d) TDS simulation model.
Download figure:
Standard image High-resolution image2.1. Physical model
The CD model assumes that defects diffuse within a homogeneous medium, where they can absorb and emit other defects, leading to their evolution over large time and length scales. To facilitate the modeling process, several reasonable assumptions are made, including:
(1) The basic types of defects included in the model are self-interstitial atoms (SIAs, I), vacancies (V), hydrogen atoms (H) and their complex clusters formed by binary reactions (, where m and n represent the number of point defects in a loop/cluster). In addition, other inherent sinks are also included like dislocation lines (DLs) and grain boundaries (GBs).

(2) On the one hand, only a few interstitial clusters can be formed under the implantation of 2 keV D ions. On the other hand, DFT calculations have found that H trapping energies in small complexes are approximately 0.3 eV in W [29, 30]. This suggests that clusters are not effective trapping sites for H, as most trapped H can be released from below room temperature [25]. For the sake of simplification, it is thus reasonable to neglect the impact of interstitial clusters on H retention and desorption here.


(3) In theory, the mobility of different defects is determined by their respective migration energies and the sample temperature. However, the concentration of large defect clusters formed is relatively low under H implantation at low incident energies (below several keV). Thus, the influence on defect evolution can be neglected even without considering the mobility of these large clusters. To simplify our model, we assume that only SIAs (I), di-interstitials (), vacancies (V) and hydrogen atoms (H) are mobile, while all other defect clusters are considered immobile.

The evolution of these defects is described by a set of master equations, which can be expressed as,

where (in the unit of m−3) is the concentration of defect . On the right-hand side of equation (1), the first term (in the unit of m−3 · s−1) represents the generation rate of defects. For H implantation, our open-source program IM3D is used to simulate the primary radiation damage for defect generation [31]. The second term accounts for the spatial diffusion of defects, where (in the unit of ) denotes the defect diffusion coefficients. The third term describes the sum of all the forward and reverse reactions, where (in the unit of s−1) represents the transition rate coefficient per unit concentration of a defect of type to a defect of type (as listed in table 1). Due to low vacancy concentrations, and small rate coefficients resulting from the large diffusion barrier for monovacancies in W, the forward reaction flux between V and Vn exhibits a relatively low magnitude under low-energy D irradiation here. This aligns with first-principles studies which demonstrates that the interaction of bi-vacancies is predominantly repulsive in W because of the negative values of the binding energies between monovacancies [32, 33]. Therefore, for the sake of computational efficiency, these reactions can be simplified or disregarded.


Table 1. Reaction types and the corresponding rate coefficients.


The final term refers to the absorption of point defects (I/V/H) by inherent sinks including DLs and GBs here. In most previous CD models like IRadMat, it is simply expressed as,

where and are the sink strengths (in the unit of m−2) of DLs and GBs to defect , respectively. They can be estimated by the dislocation density and the grain size d [34, 35] that,


and

respectively, where is the dimensionless capture efficiency, and represents the total sink strength from all other microstructures in a single crystal except for GBs.


However, a polycrystalline sample is composed of multiple independent grains that are separated by GBs with various interface areas. The interactions between GBs and H atoms are also characterized by different binding energies. Therefore, it becomes necessary to consider multiple trapping effects caused by various types of GBs in IRadMat-TDS. For m-type GB, its interface area can be defined as,


Here, represents the total interface area of all GBs in the material, while denotes the area proportion of m-type GB (, where is the number of GB types). Since the interface area per volume (in the unit of m−1) can be derived from , by substituting equation (5) into equation (4), the sink strength of m-type GB becomes that,


In most previous CD models like IRadMat, the absorption of H in GBs and DLs is approximatively seen as infinite absorption. However, Zhou et al have shown that the ∑5(310) tilt GB in W can accommodate no more than two H atoms by DFT calculations [36]. This finding suggests that the absorption by GBs reaches saturation with the increasing number of trapped H atoms. Therefore, it is necessary to set saturated concentrations of trapped H in inherent defects in IRadMat-TDS that,

and

Here, and (in the unit of m−3) are the volume concentrations of H in DLs and m-type GB, respectively. and (in the unit of m−3) are the saturated volume concentrations of H in DLs and m-type GB, respectively. (in the unit of ) and (in the unit of m−2) are the number of trapping sites per unit length in DLs and per unit area in GBs, respectively.


Generally, intrinsic point defects (I/V) are considered not to be emitted from inherent defects in most previous models [37]. However, the emission of H from DLs/GBs cannot be neglected especially during heating process. The ratios of absorption rate coefficients to emission rate coefficients of H in DLs and GBs from [37] can be transformed to,

and

respectively. and represent the emission rate coefficients of H from DLs and m-type GB, respectively. b denotes the Burgers vector. and are the binding energies between H and DLs or m-type GB, respectively. Here, the additional factors of and arise from the transformations from H linear concentrations in DLs (, in the unit of m−1) and H surface concentrations in m-type GB (, in the unit of m−2) to H volume concentrations, and , respectively. These conversions are based on the relationships and .


From equations (6) and (10), it can be seen that the absorption and desorption of H in multiple GBs can be characterized by two key parameters: the area proportion of m-type GB, , and its binding energy with H, . According to first-principles calculations, H atoms have a tendency to occupy the trapping sites in GBs with randomly available free volumes that are typically smaller compared to vacancies. Moreover, as more H atoms are introduced into GBs, the available volumes for H decreases, with the weak absorption of multiple H atoms by a single GB. Thus, the binding energies of H with various GBs generally fall in the range of 0–1.2 eV. These energies vary randomly due to different types of GBs and numbers of trapped H, up to the binding energy between H and vacancies [38] and approaching zero with the increasing number of trapped H [39–41]. Experimental findings indicate that the average binding energy associated with the H desorption peak from GBs in TDS is approximately 0.6 eV [13, 15], which coincides with the theoretical average value. Therefore, it is reasonable to assume that the distribution of various types of GBs and their respective binding energies with H follow a Gaussian distribution. The peak of this distribution represents the most probable binding energy of GBs. Consequently, we can assume that the Gaussian probability of binding energies, , corresponds to the area proportion of m-type GB, . With these assumptions and according to equation (6), the sink strengths of various GBs should also exhibit a similar Gaussian distribution.


Finally, the improved absorption term of H by DLs and GBs can be written by,

and

respectively.
2.2. TDS model
During TDS measurement, H isotopes retained in the sample can desorb from various defects/sinks with distinct de-trapping energies, leading to the variation of the gas release rate. In general, this method is relatively simple and effective in determining both the total H retention and characteristic temperatures of H release from the material.
Our CD simulation involves four main steps, namely implantation, isothermal annealing, continuous linear temperature annealing and TDS analysis. By solving the ordinary differential equations, we can obtain the total retained amount (in the unit of m−2) at different temperatures. Therefore, the total desorption amount (in the unit of m−2) can be determined by subtracting the total retained amount from the initial retained amount that,


Thus, the desorption rate of D (in the unit of m−2 · s−1) as a function of temperature, namely TDS spectrum, can be given using the following equation,

Besides quantitative simulation of the total TDS, the contributions of various defects to the total retention/desorption can be accurately determined from the concentration evolution in terms of size, depth, time and temperature, as shown in figure 1(c). During the simulation of thermal annealing, it is noteworthy that as H diffuses from the bulk to the surface, it may become trapped in various defects and subsequently released. The concentrations of trapped and released H in these defects change dynamically and can re-engage in reactions between different defects. Therefore, our model inherently accounts for the re-trapping process of H.

3. Results and discussion
3.1. Model parameters and validation
In order to achieve a more comprehensive understanding of the experimental results, we calibrate our CD simulation using data from Taylor et al's experiments [42]. We selected these TDS experiments based on their clear detection of low-temperature desorption peaks typically from about 300–700 K. These low-temperature desorption peaks always appear in almost all measured TDS for H in W, but their attributions have yet to be clearly identified [12–15]. To ensure the reliability and accuracy of our model, we carefully choose the fundamental kinetic and energetic parameters by considering the published values from ab initio/MD calculations or experiments, as shown in table 2. Further details of the transition rate coefficients can be found elsewhere [26–28]. The capillary law [43] is used to extrapolate the binding energies of mobile point defects with different types of large clusters. The binding energies between H and Hm Vn are obtained from ab initio calculations for small sizes and extrapolated for large sizes as described in [44]. Figure 2 presents the initial depth distributions of the displacements (I/V) and D implantation calculated by IM3D. D ions with 2 keV energy can cause damage and implantation at depths of tens of nanometers in W.

Figure 2. Depth distribution of implanted D and I/V calculated by IM3D [31] with the incident energy of 2 keV.
Download figure:
Standard image High-resolution imageTable 2. Summary of simulation parameters.
| Parameter | Symbol | Value | Reference |
|---|---|---|---|
| Sample thickness | — | 50 μm | [42] |
| Irradiation temperature | — | 317 K | [42] |
| Implantation fluxes | — | 1.2 × 10¹⁹–2.8 × 10¹⁹ D m−2 · s | [42] |
| Implantation fluences | — | 3.2 × 10²⁰–3.2 × 10²² D · m−2 | [42] |
| Lattice constant | 0.3165 Å | [45] | |
| Grain size | d | 10 μm | [46] |
| Dislocation density | 1012 m−2 | [47] | |
| Recombination radius | 4.65 Å | [27] | |
| Interstitial pre-exponential factor | 10−8 m−2 · s−1 | [47] | |
| Vacancy pre-exponential factor | 1.77 × 10⁻⁶ m−2 · s−1 | [48] | |
| D pre-exponential factor | 4.1 × 10⁻⁷ m−2 · s−1 | [49] | |
| SIA/dislocation elastic interaction | 1.2 | [50] | |
| Formation energy of SIA | 9.466 eV | [51] | |
| Formation energy of V | 3.80 eV | [51] | |
| Formation energy of H | 2.45 eV | [34] | |
| Migration energy of SIA | 0.013 eV | [52] | |
| Migration energy of V | 1.66 eV | [52] | |
| Migration energy of H | 0.39 eV | [53] | |
| Binding energy of I2 | 2.12 eV | [54] | |
| Binding energy of V2 | −0.115 eV | [54] | |
| Binding energy of H-I | 0.33 eV | [55] | |
| Binding energy of H-DL | 0.53 eV | [56] | |
| Binding energy of H-GB | 0.64 eV | [40] |


By utilizing the parameters listed above, we can simulate the total amount of retained D after 2 keV D ion irradiation with the fluences ranging from 3.2 × 10²⁰ to 3.2 × 10²² D · m−2 (corresponding to fluxes between 1.2 × 10¹⁹ and 2.8 × 10¹⁹ D · m−2 · s–1). The simulated data is compared with all of the literature data shown in figure 3(a). According to Taylor's experiments, the total retention exhibits a slow increase with increasing fluence, varying by only one order of magnitude [42]. This modest growth is similar to the finding in Sakamoto's experiments [57] in the intermedia fluence region of 1020–1022 D · m−2. However, the simulated retention, which does not consider the saturated absorption and emission by inherent sinks, shows a rapid linear increase, spanning nearly two orders of magnitude. This discrepancy indicates that the assumption of infinite absorption by GBs and DLs in previous models could be unreasonable at high fluences. In fact, as the fluence increases, the free trapping sites in GBs and DLs could gradually fill up. As mentioned in section 2.1, theoretical studies have also shown that the absorption of H in GBs and DLs may reach saturation with the increasing number of trapped H. After incorporating the saturated absorption and emission of H in GBs and DLs, the simulated retention (red dotted line in figure 3(a)) thus shows good agreement with the experimental results at different fluences. The observed increase in total retention is consistent with the higher D concentration at elevated fluences.

Figure 3. Comparison of simulated results with experimental ones [42]. (a) Total retained D versus fluence after 2 keV D ion irradiation with the fluxes between 1.2 × 10¹⁹ and 2.8 × 10¹⁹ D · m−2 · s–1. The simulations are carried out with and without the saturated absorption and emission of H in GBs and DLs. (b) TDS after 2 keV D ion irradiation with a fluence of 1022 D · m−2 at 317 K. The ramp rate is 0.5 K · s−1.
Download figure:
Standard image High-resolution imageFigure 3(b) shows the comparison between our simulated TDS and experimental results after 2 keV D ion irradiation with a fluence of 1022 D · m−2. The simulation successfully reproduces both the positions and intensities of the two distinct desorption peaks at around 490 and 550 K, respectively. Obviously, the low-temperature peak exhibits a higher intensity, indicating a significant contribution from low-temperature traps. Nevertheless, the simulated TDS displays a narrower width compared to the experimental spectrum, corresponding to the lower simulated total retention in figure 3(a). The narrower width of the spectrum should be attributed to the absence of describing certain complex physical processes, such as the desorption of D from the multi-trapping effect of sinks (like GBs and DLs) and specific defects (like D-induced voids). Further discussion about this discrepancy can be found in section 3.3.
3.2. Effect of various defects on D retention/desorption
In the following, we will focus on the comprehensive mechanisms of D retention and desorption in W. Figure 4 shows the depth distributions of the total retained D, clusters, and the absorption of D by DLs and GBs, respectively. Three typical regions of H depth distribution are revealed as expected [5]: (1) the near-surface heavily damaged zone (up to tens of nanometers as the same as ion implantation depth), which exhibits a remarkable concentration peak. (2) The sub-surface platform region (from tens of nanometers to several microns) due to the saturated absorption of D by GBs and DLs. (3) The declining region in the bulk owing to the attenuation of D concentration by diffusion.


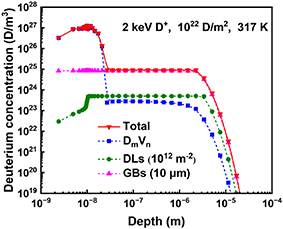
Figure 4. Simulated depth profile after 2 keV D ion irradiation with a fluence of 1022 D · m−2 at 317 K.
Download figure:
Standard image High-resolution imageFigure 5(a) presents the simulated total and partial D retention as a function of the annealing temperature. The amount of D trapped in DLs is relatively low and begins to diminish at approximately 350 K. In contrast, the amount of D trapped in GBs is remarkable and exhibits a decline after about 450 K. Additionally, the retention of D in the form of undergoes an obvious drop around 550 K. In fact, these variations indicate different rates of H desorption from different defects/sinks with distinct de-trapping energies. Following the method given in section 2.2, the total and partial TDS spectra are simulated accordingly, as shown in figure 5(b). According to the simulated partial TDS, the peak at around 490 K mainly arises from the release of D from GBs. The shoulder at approximately 550 K can be attributed to D desorption from irradiation-induced vacancies. Most of the conclusions drawn from previous TDS measurements of D in W have emphasized the contribution of single vacancies while ignoring the roles of GBs and DLs [6, 58, 59]. Some studies also simply attributed the low-temperature desorption peaks to the trapping of D in low-temperature defects without identifying the specific defect types [7, 10]. However, our research explicitly reveals that D retention in GBs is more pronounced than that in DLs.


Figure 5. (a) Simulated retention as a function of the annealing temperature after 2 keV D ion implantation with a fluence of 1022 D · m−2 at 317 K. (b) Simulated total and partial TDS spectra at the heating rate of 0.5 K · s−1.
Download figure:
Standard image High-resolution imageThe integral area of the GBs and vacancy peaks contributes approximately 70% and 30% to the total release, respectively. In contrast, the desorption of D from DLs is negligible. In fact, we can estimate these ratios in principle as follows: firstly, GBs and DLs are uniformly distributed throughout the whole W bulk. The number of trapping sites per unit area in GBs, , is theoretically proportional to the inverse square of the distance (d0) between two nearby trapping sites, . Since this distance d0 is typically on the order of angstroms (10−10 m), the value of should thus be on the order of 1020 m−2. Similarly, the number of trapping sites per unit length in DLs, , is proportional to and thus on the order of 1010 m−1. Therefore, the theoretical limit of D concentration retained in GBs (with grain size of 10−5 m) is about 1025 m−3, which is at least 3 orders of magnitude higher than that in DLs (with dislocation density of 1012 m−2) of about 1022 m−3. Secondly, despite a high concentration of lattice displacements near the surface, approximately 1029 m−3 as shown in figure 2, the concentration of vacancies diminishes significantly beyond 20 nm depth. As a result, the eventual amount of D retained in vacancies falls somewhere between those in GBs and DLs. It thus provides an easy way to identify the attribution of the characterized peaks in TDS, by just considering the densities of vacancies, GBs and DLs.


Overall, the mechanisms of low-energy D retention and desorption in polycrystalline W can be summarized as: (1) the total D retention is mostly contributed by D trapped in GBs. (2) D retention in DLs is negligible. (3) D trapped in vacancies near the surface accounts for an intermediate portion of total D retention. By splitting the partial TDS, defect types and their respective contributions to TDS are explicitly identified. This clarifies the previously ambiguous attribution of desorption peaks. Moreover, it makes us effectively address the long-standing dispute over quantitative characteristics of H retention in typical defects within H-W systems.
3.3. TDS peak width improvement with the multi-trapping effect of GBs
The simulated TDS reproduces the experimental peak positions and intensity well, but not the peak width. We have analyzed three factors that could cause the narrowing of the main peak and the shoulder. Firstly, the narrow peak width at 490 K could potentially be attributed to the use of single binding energy (=0.64 eV) that fails to truthfully describe the multiple interactions between D and various types of GBs in polycrystalline W. Secondly, the extended shoulder in the experimental TDS, ranging from 570 to 700 K, could be due to H desorption from high-temperature traps, particularly large D-induced sinks like vacancy clusters and dislocation loops. Numerous studies have shown that low-energy, high-flux D plasma irradiation on W can cause the formation of cavities/blisters due to the increase of dislocation or void density induced by D supersaturation near the surface [60–67]. The formation of large blisters observed in the experimental samples further supports this hypothesis [42]. Thirdly, measurement errors in both the heating furnace and thermocouple could potentially cause deviations in the peak width between experimental and simulated results more or less.

Here, we consider the complex interactions between D and various types of GBs as an example for improving the simulated peak width. As mentioned in section 2.1, an accurate characterization of the multi-trapping effect of GBs necessitates a comprehensive assessment of the absorption and emission of D in different GBs, as determined by the area proportion of m-type GB () and its binding energy with D (). Given the limited detailed information on specific GB energy distributions from both experimental and theoretical sources, we select six energy values that follow a fitted Gaussian distribution. This distribution has a mean of approximately 0.63 eV and a full width at half maximum of about 0.14 eV. The area proportions of GBs with these six energies correspond to respective Gaussian probabilities. Table 3 summarizes the six values of and used in our simulation. Figure 6(a) presents the intensity differences of the corresponding individual GB peaks after simulation. It is evident that as the binding energies increase from 0.41 to 0.80 eV, the corresponding peak intensity initially increases and then decreases, reaching a maximum at 0.64 eV. The resulting convolution of these individual peaks ultimately contributes to the broad GBs desorption peak. In addition, the partial desorption fluxes for GBs marked 3–6 appear to be negative in figure 6(a). It indicates that the previously released D from GBs with lower binding energies are subsequently re-trapped in GBs with higher binding energies. We will discuss this indirect desorption behavior of D in more detail in the future.


Figure 6. (a) Simulated desorption peaks of D from various GBs with distinct binding energies. (b) Normalized TDS simulated with and without multi-trapping effect of GBs after 2 keV D ion irradiation with a fluence of 1022 D · m−2 at 317 K.
Download figure:
Standard image High-resolution imageTable 3. Binding energies and interface area proportion of different types of GBs.
| m | (eV) | |
|---|---|---|
| 1 | 0.41 | 0.0125 |
| 2 | 0.52 | 0.1170 |
| 3 | 0.60 | 0.3413 |
| 4 | 0.64 | 0.4302 |
| 5 | 0.72 | 0.0873 |
| 6 | 0.80 | 0.0101 |


Figure 6(b) shows a comparison between the total TDS simulated with and without the multi-trapping effect of GBs. The total TDS simulated with the multi-trapping effect (blue line) exhibits a noticeable broadening on the left side compared to that without the multi-trapping effect (red line). It suggests that the single-site approximation for GBs is primarily responsible for the previously simulated narrow peak near 490 K. As mentioned above, the narrow shoulder on the right side of the simulated TDS should be attributed to the neglect of the capture of D by D-induced sinks. In recent years, some researchers have attempted to explain hydrogen bubble formation and severe blistering phenomena by proposing mechanisms such as 'loop punching' and 'vacancy clustering' [60–67]. Even so, the underlying mechanism of the formation of D-induced sinks is still far from clear. In addition, accurately modeling the detailed size and depth distribution of D-induced sinks is always a significant challenge. Therefore, it is really hard to improve the width of the simulated shoulder. Nevertheless, the interaction between D and these induced sinks is similar to the interaction between D and GBs. The improvement in the peak width due to GBs provides compelling evidence that the previously narrow shoulder in the simulated TDS is caused by the same mechanism.
4. Conclusions
An improved CD model, IRadMat-TDS, has been developed to comprehensively investigate H retention and desorption behaviors and the underlying mechanisms in W. The model has been significantly improved by introducing the saturated absorption and emission of H in GBs and DLs. Its accuracy was confirmed by comparing the simulated total retention with measurements for 2 keV D ion irradiation with different fluences. Moreover, our simulations successfully reproduced both the position and intensity of the experimental TDS. Through analyzing the attribution of simulated depth profiles and partial TDS to various defects, we found that D retention in GBs contributes the most, followed by that in vacancies, whereas that in DLs is nearly negligible. The main peak at 490 K and the shoulder from 550 to 700 K can thus be explicitly attributed to the capture of D in GBs, and in displacement vacancies and/or D-induced voids, respectively. Furthermore, the discrepancy in peak width at 490 K between simulated and experimental TDS was eliminated through considering complex interactions of D with various types of GBs. It proves that the broad peaks in TDS are the convolution of multiple individual peaks corresponding to various trapping sites. The results are helpful for understanding the complex H retention and desorption in W, which will promote the development of new PFMs in nuclear fusion reactors.
Acknowledgments
This work was supported by the National Natural Science Foundation of China (Grant Nos. 12375277 and 11975018), the Anhui Provincial Natural Science Foundation (Grant No. 2308085J04) and the outstanding member of Youth Innovation Promotion Association CAS (Grant No. Y202087). Our calculations were performed at the Center for Computational Science of CASHIPS, the ScGrid of Supercomputing Center, and the Computer Network Information Center of the Chinese Academy of Sciences. We thank for Professor Taylor from Idaho National Laboratory for providing experimental data and helpful discussion.