


ABSTRACT
The dwarf spheroidal galaxies (dSph) of the Milky Way are among the most attractive targets for indirect searches of dark matter (DM). In this work, we reconstruct the DM annihilation (J-factor) and decay profiles for the newly discovered dSph Reticulum II. Using an optimized spherical Jeans analysis of kinematic data obtained from the Michigan/Magellan Fiber System, we find Reticulum II's J-factor to be among the largest of any Milky Way dSph. We have checked the robustness of this result against several ingredients of the analysis. Unless it suffers from tidal disruption or significant inflation of its velocity dispersion from binary stars, Reticulum II may provide a unique window on DM particle properties.
1. INTRODUCTION
Along with the Galactic center and Galaxy clusters, the dwarf spheroidal galaxies (dSph) of the Milky Way have been identified as promising targets for indirect dark matter (DM) searches (see, e.g., Strigari 2013; Conrad et al. 2015). Their low astrophysical background, high mass-to-light ratio, and proximity make them compelling targets (Lake 1990; Evans et al. 2004). About 25 Galactic dSphs were known as of early 2015, and their observation by γ-ray telescopes has thus far shown no significant emission, leading to stringent constraints on , the thermally averaged DM annihilation cross-section (Acciari et al. 2010; Paiano et al. 2011; Abramowski et al. 2014; Geringer-Sameth et al. 2014; Fermi-LAT Collaboration 2015).

Recently, imaging data from the Dark Energy Survey have led to the discovery of nine new potential Milky Way satellites in the Southern sky (DES Collaboration et al. 2015; Koposov et al. 2015a). The nearest object, Reticulum II (Ret II, kpc), is particularly intriguing, as evidence of γ-ray emission has been detected in its direction using the public Fermi-LAT Pass 7 data. Geringer-Sameth et al. (2015b) determined the probability of background processes producing the observed Ret II gamma-ray signal to be between and , depending on the background modeling. An analysis of the new objects published simultaneously by Fermi-LAT Collaboration et al. (2015), based on the unreleased Pass 8 data set, reported no significant detection, though the strongest hint was for Ret II with . Hooper & Linden (2015) subsequently performed a similar analysis with public Pass 7 data, finding a p value of .


In any case, a robust determination of Ret II's DM content is crucial in order to constrain particle nature of DM. Ret II was found to be a DM-dominated dSph galaxy from the independent chemodynamical analyses of Walker et al. (2015), Simon et al. (2015), and Koposov et al. (2015b). Here, we reconstruct the DM annihilation and decay emission profiles of Ret II from a spherical Jeans analysis applied to stellar kinematic data obtained with the Michigan/Magellan Fiber System (M2FS; Walker et al. 2015). We use the optimized Jeans analysis setup from Bonnivard et al. (2015a, 2015b), and compute the astrophysical J- and D-factors, for annihilating and decaying DM, respectively, from the reconstructed DM density profiles. We cross-check our results by varying different ingredients of the analysis and evaluate the ranking of Ret II among the most promising dSphs for DM indirect detection.
2. ASTROPHYSICAL FACTORS, JEANS ANALYSIS, AND DATA SETS
2.1. Astrophysical Factors
The differential γ-ray flux coming from DM annihilation (resp. decay) in a dSph galaxy is proportional to the so-called "astrophysical factor" J (resp. D; Bergström et al. 1998),

which corresponds to the integration along the line of sight (LOS) of the DM density squared (resp. DM density) and over the solid angle , with the integration angle. This quantity depends on both the extent of the DM halo and the mass density distribution, and is essential for constraining the DM particle properties. All calculations of astrophysical factors are done with the CLUMPY code (Charbonnier et al. 2012), a new module of which has been specifically developed to perform the Jeans analysis.6
![${\rm{\Delta }}{\rm{\Omega }}=2\pi \times [1-\mathrm{cos}({\alpha }_{\mathrm{int}})]$](https://content.cld.iop.org/journals/2041-8205/808/2/L36/revision1/apjl516101ieqn7.gif)

2.2. Jeans Analysis
Several approaches have been developed to infer the DM density profile of dSph galaxies from stellar kinematics (see, e.g., Battaglia et al. 2013; Oswalt & Gilmore 2013; Strigari 2013). Here, we focus on the spherical Jeans analysis, a widely used approach for the determination of astrophysical factors (Strigari et al. 2007; Essig et al. 2010; Charbonnier et al. 2011; Cholis & Salucci 2012; Bonnivard et al. 2015a; Geringer-Sameth et al. 2015a). We refer the reader to Bonnivard et al. (2015b) for a thorough description of the analysis setup we use in this work. Here, we summarize the main ingredients.
Assuming steady-state, spherical symmetry, and negligible rotational support, the second-order Jeans equation, obtained from the collisionless Boltzmann equation, reads (Binney & Tremaine 2008)

with the stellar number density, the radial velocity dispersion, the velocity anisotropy, and M(r) the mass7 enclosed within radius r. After solving Equation (2) and projecting along the LOS, the (squared) velocity dispersion at the projected radius R reads


with the surface brightness profile. We compare the LOS velocities of the stars to the projected velocity dispersion , computed using parametric forms for the unknown velocity anisotropy and DM density profile . We use the following likelihood function (Strigari et al. 2007):


which assumes a Gaussian distribution of LOS stellar velocities vi, centered on the mean stellar velocity , with a dispersion of velocities (at the radius Ri) coming from both the intrinsic dispersion and the measurement uncertainty . Probability density functions (PDFs) of the anisotropy and DM parameters are obtained with a Markov Chain Monte Carlo (MCMC) engine,8 and are used to compute the median and credible intervals (CIs) of the astrophysical factors for any integration angle.


Following the optimized Jeans analysis setup proposed in Bonnivard et al. (2015b), the DM density is described by an Einasto profile (Merritt et al. 2006), and the anisotropy and light profiles are given by Baes & van Hese (Baes & van Hese 2007) and Zhao–Hernquist (Hernquist 1990; Zhao 1996) parametrizations, respectively. The large freedom allowed by these parametrizations was found to mitigate possible biases of the Jeans analysis (Bonnivard et al. 2015b). Finally, the extent of the DM halo is computed using the tidal radius estimation as in Bonnivard et al. (2015a).
2.3. Data Set
Surface brightness data—we fit the stellar number density profile of Ret II following the procedure that Bonnivard et al. (2015a) use for "ultrafaint" dSphs (see their Section 3.1). We consider a flexible Zhao–Hernquist model for the 3D profile,


where the five parameters are the normalization , the scale radius , the inner power law index γ, the outer index β, and the transition parameter α. Along with an additional free parameter that represents a uniform background density, these parameters then specify a model for the projected stellar density:


We fit this model to the photometric catalog generated by Koposov et al. (2015a), which provides positions, colors, and magnitudes of individual stars detected as point sources. From the raw catalog, we first identify possible members of Ret II as point sources (selected as sources with Sextractor "spread" parameter <0.01 in the g-band) whose extinction-corrected colors place them within 0.25 dex of the Dartmouth isochrone (Dotter et al. 2008), calculated for a stellar population with age 12 Gyr, metallicity , and distance modulus (Koposov et al. 2015a). To the unbinned distribution of projected positions for the N = 12470 RGB candidates identified within 1.5° of Ret II's center, we fit 2D projections of according to the likelihood function:

![$[\mathrm{Fe}/{\rm{H}}]=-2.5$](https://content.cld.iop.org/journals/2041-8205/808/2/L36/revision1/apjl516101ieqn24.gif)


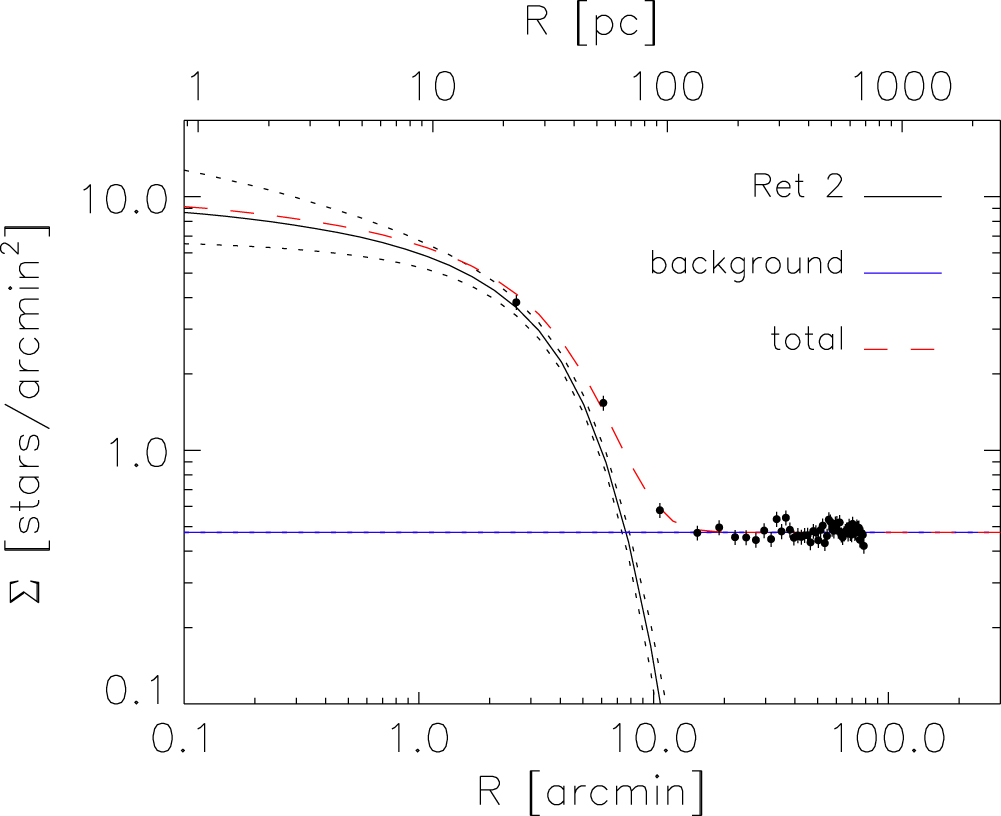
As in Bonnivard et al. (2015a), the fit is done with the software package MultiNest (Feroz & Hobson 2008; Feroz et al. 2009, 2013), and we use the samples from the posterior PDFs to propagate the light profile uncertainty into the Jeans analysis. Figure 1 shows the fit to the projected stellar density profile of Ret II (dashed red line), with the contributions from Ret II itself and from the constant background (solid black and blue lines, respectively).

Figure 1. Projected stellar density profile of Ret II, derived from the photometric catalog of Koposov et al. (2015a). Overplotted (red line) is the best-fitting model (we note that the fit is to the unbinned data), which is the sum of contributions from Ret II itself and a constant background (see Section 2.3). Dotted lines enclose 68% CIs for the projection of .

Download figure:
Standard image High-resolution imageKinematic data—we use the Ret II stellar kinematic data set from Walker et al. (2015), obtained with M2FS. It consists of projected positions and LOS velocities for 38 individual stars, as well as an estimation of their membership probability Pi. The latter, obtained using an expectation maximization algorithm (Walker et al. 2009), quantifies the probability that a given star belongs to the dSph or to the Milky Way foreground.
The top panel of Figure 2 presents the velocity dispersion profile of Ret II, as well as its reconstruction with the Jeans analysis.9 The bottom panel of Figure 2 shows the distribution of membership probabilities as a function of the projected radius R and the departure from the mean velocity (color-coded), for stars with non-zero Pi. As pointed out in Bonnivard et al. (2015a), a large fraction of stars with both intermediate Pi () and large departure from the mean velocity hints at Milky Way foreground contamination, which can affect the J- and D-factor reconstruction. For Ret II, only one star shows an intermediate Pi (Ret2-142 in the catalog of Walker et al. 2015, with Pi = 0.69), with a very small departure from the mean velocity. Therefore we do not expect a strong sensitivity to foreground contamination. In this study, and as advocated in Bonnivard et al. (2015a), we use the data with (16 likely members, one less than identified by Walker et al. 2015 after exclusion of Ret2-142) as our fiducial setup.


Figure 2. Top: velocity dispersion profile of Ret II and reconstructed median and credible intervals (solid and dashed black lines, respectively), as well as best fit (see footnote 9; long dashed red lines). Bottom: distribution of membership probabilities as a function of the projected radius R and the departure from the mean velocity (z-axis, blue to red color) for the eighteen stars with . The size of the points is proportional to the velocity uncertainty. See text for discussion.

Download figure:
Standard image High-resolution image3. RESULTS
Figure 3 displays the J- (top) and D-factors (bottom) of Ret II, reconstructed from the Jeans/MCMC analysis, as a function of the integration angle . Solid lines represent the median values, while dashed and dash–dot lines symbolize the 68% and 95% CIs respectively. Our data-driven Jeans analysis gives large statistical uncertainties due to the small size of the kinematic sample, comparable to those obtained for other "ultrafaint" dSphs by Bonnivard et al. (2015a; see also Figure 4). Table 1 summarizes our results for the astrophysical factors of Ret II.


Figure 3. Median (solid), 68% (dashed), and 95% (dash–dot) CIs of the J- (top) and D-factors (bottom) of Ret II, as a function of integration angle, reconstructed from our Jeans/MCMC analysis.
Download figure:
Standard image High-resolution image
Figure 4. Comparison of the J-factors at obtained for Ret II (red circle) and for the potentially brightest objects from Bonnivard et al. (2015a) (blue squares), with the same Jeans/MCMC analysis. Ret II is comparable to Wil I in terms of J-factors, but slightly below Coma and UMa II. A 0.4 dex systematic uncertainty was added in quadrature to the 68% CIs to account for possible triaxiality of the DM halo (Bonnivard et al. 2015b). Also shown are the J-factors obtained for Ret II by varying different ingredients of the analysis—see Section 3.

Download figure:
Standard image High-resolution imageTable 1. Astrophysical Factors for Ret II (d = 30 kpc)
| (deg) | a | b |
|---|---|---|
| 0.01 | ||
| 0.05 | ||
| 0.1 | ||
| 0.5 | ||
| 1 |


Notes. For five different integration angles, the median J (resp D)-factors as well as their 68% and 95% CIs are given. Note that possible triaxiality of the dSph galaxies adds a systematic uncertainty of ±0.4 (resp. ±0.3) (Bonnivard et al. 2015b) and is not included in the quoted intervals.
a1 GeV2 cm kpc−5. b1 GeVcm kpc−2.

Download table as: ASCIITypeset image
We cross-check our findings by varying different ingredients of the Jeans analysis. The resulting J-factors are shown in Figure 4. First, we perform a binned Jeans analysis (see Bonnivard et al. 2015a) of the kinematic data, and find compatible results. Second, we calculate the bootstrap mean and dispersion of the J-factor (Efron 1982). For this purpose, we generate 500 bootstrap resamples10 by drawing with replacement 16 stars among the 16 of the original sample with . The results are in excellent agreement with the MCMC analysis. Finally, we use all 38 stars of the sample but weight the likelihood function of Equation (4) by the membership probabilities Pi (Bonnivard et al. 2015a). As only one star shows an intermediate membership probability , we obtain very similar results. These two tests confirm that the reconstruction of the astrophysical factors of Ret II is not significantly affected by outliers. This is not always the case, notably for Segue I (V. Bonnivard et al. 2015, in preparation).


We note that Simon et al. (2015) independently performed an analysis of the M2FS Ret II spectroscopic data and found a slightly smaller J-factor. This can be traced to their choice of priors and light profile (L. Strigari 2015, private communication). A detailed comparison will be presented in A. Geringer-Sameth et al. (2015, in preparation).
4. COMPARISON TO OTHER dSphs
The same Jeans analysis has been applied to 21 other dSphs in Bonnivard et al. (2015a). In Figure 4, we compare the J-factors (for ) of Ret II to the brightest objects identified in Bonnivard et al. (2015a).11 Ret II is comparable to Wilman I in terms of its median J-factor, but slightly below Coma Berenices and Ursa Major II. Its CIs are typical of an "ultrafaint" dSph, and significantly larger than the uncertainties of "classical" dSphs.

Interpreting the possible γ-ray signal in Ret II in terms of DM annihilation (Geringer-Sameth et al. 2015b; Hooper & Linden 2015), one would expect similar emissions from the dSphs with comparable J-factors, such as UMa II, Coma, and Wil I. However, no excess was reported from these latter objects (Geringer-Sameth et al. 2014; Fermi-LAT Collaboration 2015). This could be explained by the large statistical and systematic12 uncertainties in the J-factors. Moreover, the Jeans analysis assumes all of these objects to be in dynamical equilibrium, but tidal interactions with the Milky Way could artificially inflate the velocity dispersion and therefore the astrophysical factors. UMa II, and to a lesser extent Coma, appear to be experiencing tidal disturbance (Simon & Geha 2007; Fellhauer et al. 2007; Munoz et al. 2010; Smith et al. 2013), while Wil I may show non-equilibrium kinematics (Willman et al. 2011). Caution is therefore always advised when interpreting the astrophysical factors of these objects. The dynamical status of Ret II is not yet clear. Its flattened morphology may signal ongoing tidal disruption. However, the available kinematic data do not exhibit a significant velocity gradient that might be associated with tidal streaming motions (Walker et al. 2015).
5. CONCLUSION
We have applied a spherical Jeans analysis to the newly discovered dSph Ret II, using 16 likely members from the kinematic data set of Walker et al. (2015). We employed the optimized setup of Bonnivard et al. (2015a, 2015b), which was found to mitigate several biases of the analysis, and checked that our results are robust against several of its ingredients. We find that Ret II presents one of the largest annihilation J-factors among the Milky Way's dSphs, possibly making it one of the best targets to constrain DM particle properties. However, it is important to obtain follow-up photometric and spectroscopic data in order to test the assumptions of dynamical equilibrium as well as to constrain the fraction of binary stars in the kinematic sample. Nevertheless, the proximity of Ret II and its apparently large DM content place it among the most attractive targets for DM particle searches.
This work has been supported by the "Investissements d'avenir, Labex ENIGMASS," and by the French ANR, Project DMAstro-LHC, ANR-12-BS05-0006. M.G.W. is supported by National Science Foundation grants AST-1313045, AST-1412999. S.M.K. is supported by DOE DE-SC0010010, NSF PHYS-1417505, and NASA NNX13AO94G. M.M. is supported by NSF grants AST-0808043 and AST-1312997. E.W.O. is supported by NSF grant AST-0807498 and AST-1313006.
Footnotes
- 6
This upgrade will be publicly available in the new version of the software (V. Bonnivard et al. 2015, in preparation).
- 7
The mass is dominated by DM, and we neglect the stellar component.
- 8
- 9
The binned data and associated velocity dispersion reconstruction are only shown for illustration purposes. The final results are obtained with an unbinned analysis.
- 10
The best-fit DM profile and anisotropy parameters for each sample are obtained by maximizing the likelihood of Equation (4). J-factors were then computed for these best fitting profiles.
- 11
Segue I may have a highly uncertain J-factor (V. Bonnivard et al. 2015, in preparation). We show it only for illustration purposes.
- 12
The latter comes from a possible triaxiality of the dSph (0.4 and 0.3 dex for annihilation and decay respectively, see Bonnivard et al. 2015b), and depends on the LOS orientation with respect to the principle axes of the halo.