
Abstract
Environmentally friendly scintillators are demanded to substitute CdWO4 single crystal for X-ray imaging. Tb3+:YTaO4 single crystals are a promising candidate with a high stopping power, green emission matching to photodiodes, and a small afterglow. This study demonstrates that the light yield of Tb3+:YTaO4 scintillators is ∼ 24,000 ph/MeV. Furthermore, the fluorescence lifetime, ∼ 970 μs, though shorter than in other oxides, is close to the theoretical prediction by Judd-Ofelt analysis, indicating a high emission quantum efficiency of the Tb3+ activator. As the scintillation lifetime is shorter due to non-radiative decay, a potential light yield increase to 33,000 ph/MeV is estimated.

Content from this work may be used under the terms of the Creative Commons Attribution 4.0 license. Any further distribution of this work must maintain attribution to the author(s) and the title of the work, journal citation and DOI.
CdWO4 (CWO) is one of the earliest found and implemented scintillators still used for high-energy X-ray radiography applications.1) Its high density (ρ = 7.9 g cm−3) and stopping power (estimated as ρ*Zeff4 = 134 × 106, with an effective atomic number Zeff = 64.2), low afterglow (∼ 0.01% @ 20 ms), and radiation resistance are unique. Though its light yield (LY) is moderate (∼14,000 ph MeV−1), its intrinsic visible emission matches well with the spectral sensitivity of Si-photodiodes (Si-PDs). The possibility of producing transparent CWO single crystals using the standard Czochralski growth technique is also crucial for the device implementation in bulk form. Despite various advantages, the toxic character of Cd is a fundamental drawback since environmentally friendly materials are being demanded in evolving worldwide directives. Therefore, there is a need to develop alternative materials to substitute CWO.
Terbium is one of the typical dopants in phosphors and scintillators. Its dominant green luminescence is used in fluorescent displays, X-ray and neutron imaging, radiation dosimetry, lasers, biological markers, etc.2–12) In the particular case of scintillators, Tb3+ represents an activator ion with a remarkable emission quantum efficiency (QE) in the visible, matching well the spectral sensitivity of Si-PDs. Furthermore, since its decay is comparatively slow, with a lifetime in the millisecond order, it is suitable for applications where sensitivity and spatial resolution, rather than dynamic response, are essential. The most representative example, which has become a commercial product, is Tb:Gd2O2S (Tb:GOS).3,5,13–15) It exhibits a high density and stopping power of Tb:GOS (7.34 g cm−3 and 102x106, respectively), and a high LY. However, only translucent ceramics can be synthesized, limiting its use to thin film applications. Recently, it has been shown that among the heavy tantalates, doped YTaO4 (YTO) transparent single crystals are a promising alternative to CWO,16,17) particularly when doped with Tb. With a relatively high activator concentration, 15%Tb:YTO compromises high density and stopping power (7.76 g cm−3 and 129 × 106, respectively) with an emission maximum in X-ray luminescence (XRL). The radioluminescence LY of Tb:YTO, however, hasn't been determined yet because the decay of Tb3+ ions is too slow to carry out a standard pulse-height analysis (PHA).
This study aims to determine the LY of Y1-xTbxTaO4 (Tb:YTO, or 100·x%Tb:YTO) single crystals grown by the Floating zone (FZ) technique. Pulse area integration18) (PAI) is used to evaluate the LY instead of standard PHA. Furthermore, to assess the emission efficiency of Tb3+ activator ions, photoluminescence (PL) decay measurements upon intraatomic and conduction band excitation are measured and compared with theoretical values obtained through Judd-Ofelt (JO) analysis. By further comparison with the XRL decay, the scintillation efficiency is estimated.
Tb:YTO crystals were grown by the FZ technique using a four-xenon-lamp furnace from Crystal Systems Corp. The compositions were varied along the full solid-solution range, from low Tb concentrations up to fully substituted TbTaO4 (TTO). High-purity (4 N) oxides (Y2O3, Ta2O5, and Tb4O7) were weighed in stoichiometric ratios and mixed. Feed rods were prepared by isostatic pressing at 300 MPa and subsequent sintering at 1300 °C for 10 h under a reducing Ar+3%H2 atmosphere. Further growth details and grown crystals are shown in a previous publication.17) Here, it should be noted that the actual Tb concentration in crystals agreed with the nominal one according to energy-dispersive X-ray spectroscopy.
LY measurements were carried out by a digital PAI using a setup specially designed for scintillators with a decay time in the millisecond order.18) 137Cs isotope was used as the excitation source, which emits 662 keV gamma photons upon intermediate beta decay to metastable 137Ba of only 153 s half-life. The difference in spectral sensitivity of the photomultiplier for the emissions of Tb:YTO and BGO reference was corrected with the factor 2.026. Excitation and emission PL spectra were recorded with a Jasco-8600DS fluorescence spectrometer. PL decay measurements were obtained with a setup consisting of an oscilloscope, a chopper, a Fluorolog Jobin-Yvon photospectrometer from Horiba, and an R928 Hamamatsu photomultiplier. The continuous excitations sources were pulsed with a single narrow slit blade rotating at a frequency of 11.5 Hz. This guaranteed a long enough decay time between excitation pulses but promoted a slow rise time. While reabsorption was negligible due to the short penetration depth of excitation sources, emissions with wavelengths longer than that of excitation were selected with the spectrometer to prevent artifacts from scattered light. The 546 nm emission (5D4 → 7F5) decay was measured upon, firstly, intraatomic Tb3+ excitation (7F6 → 5D4 transition) with a 488 nm laser pointer, and, secondly, excitation in the conduction band of a host with a 222 nm lamp from Quark Technology (eVIO-100). The 437 nm emission (5D3 → 7F4) decay was measured upon intraatomic Tb3+ excitation (7F6 → 5D3 transition) with a UV LED (LED-UV365P from OptoCode Corp.). Transmittance measurements for the JO analysis were performed with a Jasco V-570 UV–vis-NIR spectrometer and a PerkinElmer Spectrum One FT/IR. The dispersion of the refractive index n from 231 to 800 nm was determined with an OPTM-A1 from Otsuka Electronics on a random crystal surface. It should be noticed that though the monoclinic crystals are optically biaxial, the anisotropy is supposed to be relatively small in these crystals.16) Within the measured range (231 to 800 nm) n didn't show any systematical change with the Tb concentration, and even agreed well with reported values for YTO19) and GdTaO420) tantalates. Therefore, the n values in the near IR range were taken from the literature.
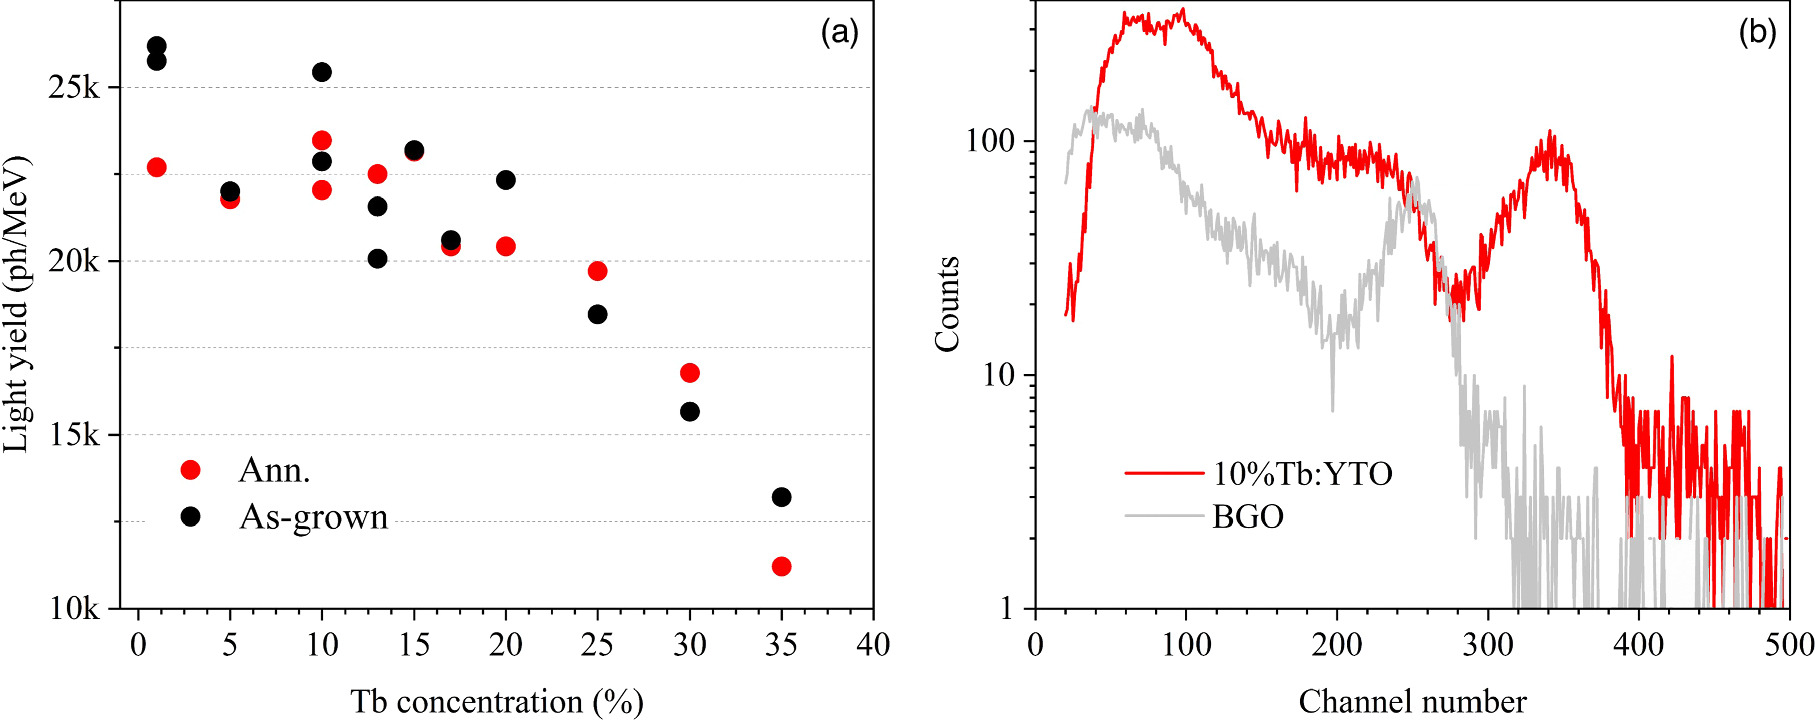
The LY of Tb:YTO crystals as a function of Tb concentration is shown in Fig. 1. The PAI analysis was carried out by comparison with the energy distribution response of a Bi4Ge3O12 (BGO) single crystal of 8,000 ph/MeV LY under the same experimental conditions. Up to 20% Tb content, the LY of all samples lies between 20,000 and 26,000 ph MeV−1, i.e. within the ∼ 10% standard deviation inherent to the PAI technique. This value is about 70% higher than that of a standard CWO. Beyond 25%Tb concentration, the LY rapidly decreases, and reliable measurements above 35%Tb couldn't be conducted under the same conditions. The LY drop with Tb concentration was equally observed in prior measurements of integrated XRL spectra, and it was attributed to quadrupole-quadrupole interactions between neighboring Tb3+ ions.17) Unlike former XRL measurements, there is no noticeable improvement after annealing under a reducing atmosphere, nor is there a clear maximum LY at 15%Tb concentration. If the annealing effect is only superficial, the difference between both results might be attributed to the largely differing penetration depth of both excitation sources. While 8 keV Cu X-rays are absorbed at the surface (within < 100 μm) in former XRL, gamma-rays in current PAI pass through the sample (penetration depth ∼ 10 cm). Therefore, the homogeneity of the annealing process requires a further detailed investigation.

Fig. 1. (a) Light yield of Tb:YTO crystals as a function of Tb concentration. (b) 137Cs γ-ray integrated pulse area response of representative 10%Tb:YTO and reference BGO.
Download figure:
Standard image High-resolution imageThe PL decay of Tb3+ ions upon dissimilar excitation paths, namely intraatomic @ 488nm and through host @ 222nm, was investigated to gain more insight into the emission efficiency. The distinction between both excitation wavelengths is understandable when considering the PL spectra. Figure 2(a) shows the excitation and emission PL of 15%Tb:YTO and TTO along with the spectra of the YTO host reference. At the same time, Fig. 2(b) illustrates the Tb3+ energy levels relative to the valence and conduction bands of the YTO host. As found by XPS,21) the valence band of YTO, mainly determined by O-2p orbitals, broadens by the appearance of Tb3+ energy levels after Tb incorporation, where the ground state 7F6 represents the new valence band maximum. As a result, the 5.0 eV bandgap of YTO narrows to the 4.0 eV one of TTO. Consequently, three excitation possibilities can be distinguished: (1) a pure Tb3+ intraatomic absorption at 488 nm, the well-known 7F6 → 5D4 transition, (2) a Tb3+-host absorption peaking at 280 nm, the transition 7F6 → Ta-5d from the Tb3+ ground level at the valence band maximum to the conduction band bottom, and (3) the host absorption peaking at 222 nm, in good correspondence with the non-doped YTO excitation maximum.

Fig. 2. (a) Excitation & emission PL spectra of 15%Tb:YTO and TTO, together with YTO host reference. (b) Schematic energy diagram of Tb3+:YTO.
Download figure:
Standard image High-resolution imageThe results of PL decay measurements are shown in Fig. 3. The PL decay curves are characterized by a single exponential component, independently of both the excitation wavelength and the Tb concentration. The decay curves of 15%Tb:YTO and TTO with the corresponding fitting are shown as examples in Fig. 3(b). This finding contrasts with the double exponential decay observed in previously measured XRL curves.17) The lifetime dependences on Tb content upon the host and intraatomic excitation are very similar to the former dependence of the slow XRL component. However, their absolute values are different. The three curves exhibit the longest lifetime for the 15%Tb:YTO crystal, indicating that the non-radiative recombination losses are minimal at this concentration. This finding completely correlates with the maximum LY observed in integrated XRL measurements. Following the same logic, the lifetimes decrease when the quadrupole-quadrupole Tb interactions quench the luminescence at higher concentrations. The following observations are made by comparison of the absolute values: (1) in the low Tb concentration range, the lifetimes upon intraatomic and host excitations are the same, indicating an optimum electronic transfer from the conduction band to the Tb3+ activator ions. (2) On the contrary, in the high Tb concentration range, the lifetime upon excitation into the conduction band is higher, indicating that the probability of non-radiative recombination of excited electrons is lower. Under the hypothesis of a homogeneous excitation of all Tb3+ centers upon intraatomic excitation, the latter observation indicates that the conduction band favors the transfer of excited electrons to radiative Tb3+ centers, lessening the transfer to non-radiative ones. (3) Upon excitation in the upper energy bands by high-energy ionizing radiation (X- or γ-rays), there is a general decrease in lifetime for all Tb concentrations, caused by non-radiative recombination losses. In other words, the LY can be improved. To evaluate the scintillation potential of Tb:YTO crystals, a detailed investigation of the theoretical transition probabilities A, branching ratios β, and radiative lifetimes τR of excited Tb3+ energy levels in Tb:YTO crystals was approached for the first time by the JO formalism.

Fig. 3. (a) Lifetime of Tb:YTO crystals upon excitation in the UV (host @ 222 nm) & visible (intraatomic @ 488 nm) as a function of Tb concentration. (b) Decay curves of 15%Tb:YTO and TTO upon UV excitation. *17).
Download figure:
Standard image High-resolution imageIn the free-ion approximation, the 4 fn electric dipole transition (ED) intensity from an initial ground state of quantum numbers (S, L, J) to an excited state of quantum numbers (S', L', J') is theoretically estimated by

where U(t) are the host independent doubly reduced matrix elements of rank t, and Ωt (t = 2, 4, 6) the JO parameters specific to the material. The JO analysis relies on accurately determining the absorption spectrum α(λ). For each state (or manifold m), the mean wavelength is calculated as , the absorption cross-section as , and the resulting line strength as

![$\mathop{{\rm{\Gamma }}}\limits^{\unicode{x00304}}=\int \alpha (\lambda )d\lambda /[{Tb}]$](https://content.cld.iop.org/journals/1882-0786/18/3/032002/revision2/apexadb89fieqn2.gif)

where n is the refractive index, c the speed of light, and h the Planck's constant. The JO parameters are determined by the least-square fitting that minimizes the difference between the theoretical (Eq. (1)) and experimental (Eq. (2)) line strengths.22)
Though magnetic dipole interactions (MD) are generally orders of magnitude smaller than ED ones, their contributions are sometimes non-negligible. Their line strengths are calculated as.23)

and the resulting transition probabilities A(J;J') as

The radiative lifetime τR and the emission branching ratio β of an excited state J' are obtained from the A(J;J') as

and

The transmittance spectra of representative crystals, namely 15% and 55%Tb:YTO, and the fully substituted TTO, were measured. The derived absorption coefficient of Tb3+ as a function of wavelength in the UV-visible-near IR is shown in Fig. 4, where the corresponding Tb3+ 4 fn excited states are indicated. The absorption cross-sections were calculated considering the Tb concentrations of the crystals (20.33, 73.89, and 133.00 × 10⁻²⁰ atoms/cm3 for 15%, 55%, and 100%Tb, respectively).

Fig. 4. Absorption coefficient of Tb3+ in the (a) UV-visible and (b) near IR wavelength regions of 15% and 55%Tb:YTO, and TTO crystals.
Download figure:
Standard image High-resolution imageThe experimental and JO calculated line strengths are summarized in Table I for three well-differentiated Tb concentrations: 15% and 55%Tb:YTO, and fully substituted TTO. The least-square fittings of the absorption bands are relatively good, as indicated by the small δ values. The obtained JO parameters Ωt (t = 2, 4, and 6) are very similar for the evaluated samples despite the largely varying Tb content, contrasting with the shifts observed with composition.24–28) The Ωt dependences observed in glasses are attributed to the modification in the local structure with the composition, the Ω2 being particularly dependent on covalency and asymmetry .25,27) As in the case of Tb:YTO, the Tb site remains invariant along the whole solid solution between YTO and TTO compounds, it is reasonable that Ωt are comparable within the errors of the semiempirical JO approximation. The calculated Ωt are relatively close to those of a Tb-doped lithium borate glass.26)
Table I. Measured and calculated average absorption line strengths of 15%Tb:YTO, 55%Tb:YTO, and TTO. Derived JO parameters Ω t and root-mean-square deviations δ.
| [Tb3+] = | 15% Tb:YTO | 55% Tb:YTO | TTO | ||||||
|---|---|---|---|---|---|---|---|---|---|
| Line strength | Line strength | Line strength | |||||||
| Transition 7F6 → | (nm) | (10−20 cm2) | (nm) | (10−20 cm2) | (nm) | (10−20 cm2) | |||
| S(exp.) | S(calc.) | S(exp.) | S(calc.) | S(exp.) | S(calc.) | ||||
| 5H7+5D0 | 319.5 | 0.0898 | 0.0866 | 319.6 | 0.0671 | 0.0815 | 319.6 | 0.0653 | 0.0754 |
| 5G2+5G3+5L6+5L7+5L8 | 342.0 | 0.1232 | 0.1262 | 342.6 | 0.0000 | 0.1254 | 343.2 | 0.0931 | 0.1131 |
| 5L9+5G4+5D2 | 352.8 | 0.1324 | 0.1832 | 352.4 | 0.0922 | 0.183 | 352.2 | 0.0767 | 0.1638 |
| 5G5+5L10 | 359.4 | 0.0961 | 0.2397 | 358.8 | 0.1289 | 0.2382 | 358.1 | 0.1024 | 0.2142 |
| 5L10+5G6 | 369.6 | 0.1208 | 0.2471 | 369.7 | 0.1098 | 0.2455 | 370.0 | 0.0701 | 0.2198 |
| 5G6+5D3 | 378.2 | 0.1740 | 0.0689 | 378.1 | 0.1708 | 0.0678 | 376.5 | 0.1752 | 0.0596 |
| 5D4 | 487.1 | 0.0351 | 0.0135 | 486.6 | 0.0374 | 0.0127 | 487.8 | 0.0270 | 0.0116 |
| 7F0+7F1+7F2 | 1877.4 | 3.2801 | 3.214 | 1873.0 | 3.2730 | 3.2116 | 1856.2 | 2.8121 | 2.8709 |
| 7F3 | 2263.0 | 1.9301 | 2.087 | 2261.4 | 1.9921 | 2.1123 | 2252.2 | 2.0799 | 1.7897 |
| 7F4 | 2958.9 | 3.2971 | 3.2152 | 2956.6 | 3.2608 | 3.1992 | 2967.3 | 2.5164 | 2.6732 |
| 7F5 | 4565.3 | 6.1340 | 6.1472 | 4539.8 | 5.7463 | 5.7558 | 4606.3 | 5.1599 | 5.1335 |
| Ω2 (× 10−20 cm2) = | 6.6 ± 0.4 | 5.7 ± 0.4 | 5.6 ± 0.5 | ||||||
| Ω4 (× 10−20 cm2) = | 3.5 ± 0.3 | 3.6 ± 0.3 | 2.8 ± 0.3 | ||||||
| Ω6 (× 10−20 cm2) = | 3.08 ± 0.11 | 3.07 ± 0.11 | 2.76 ± 0.15 | ||||||
| δ (× 10−20 cm2) = | 0.104 | 0.105 | 0.146 | ||||||


Table II summarizes the JO estimation of transition probabilities, branching ratios, and radiative lifetimes of the metastable 5D3 and 5D4 energy levels of Tb3+ for the representative case of 15%Tb:YTO. For comparison, the experimental lifetimes and branching ratios of 1% and 15%Tb:YTO obtained by PL are also given. For the greenish emission from the 5D4 level, the agreement between experimental and calculated results is reasonably good. Instead, the approximation of the bluish emission from the upper 5D3 level is less accurate. The PL emission and decay stemming from the 5D3 level are displayed in Fig. 5. There is a noteworthy difference in the most intense transitions; for 1%Tb:YTO, it is the 5D3 → 7F6, while the estimated is the 5D3 → 7F4. Furthermore, the fluorescent lifetime τPL, 440 μs from a single exponential decay, is 70% of the radiative τR with a value of 630 μs. The suppression of the bluish emission at relatively low Tb concentrations is well-known and attributed to a cross-relaxation process,29–31) as shown in the scheme of Fig. 2(b). The energy is transferred by the emission 5D3 → 5D4 from an excited Tb3+ ion and the subsequent absorption 7F6 → 7F0 at a neighboring one in the ground state. This process is resonant and accelerates the depopulation of the 5D3 level, quenching the bluish emission by shortening its lifetime. Meanwhile, it favors the increase in the greenish emission by the population of the 5D4 level.31,32) Additionally, it should be noticed that the observation of the bluish emission in Tb:YTO crystals is indicative of a homogeneous Tb distribution in the rare earth site since the presence of Tb clusters would quench the emission.
Table II. Calculated line strengths S, transition probabilities A, branching ratios β, and radiative lifetimes τR of 5D3 and 5D4 energy levels of Tb3+ for the representative 15%Tb:YTO crystal. Experimental branching ratios βPL and fluorescent lifetimes τPL of 1% and 15%Tb:YTO crystals are given for comparison.
| Transition | λ (nm) | S (x10−20 cm2) | AED (s−1) | AMD (s−1) | β | τR (ms) | 1%Tb:YTO | 15%Tb:YTO | ||
|---|---|---|---|---|---|---|---|---|---|---|
| βPL | τPL (ms) | βPL | τPL (ms) | |||||||
| 5D3 → 5D4 | 1725.9 | 0.4867 | 83.16 | 60.201 | 0.090 | — | ||||
| 7F0 | 484.7 | 0 | 0 | 0 | 0.000 | — | ||||
| 7F1 | 479.5 | 0.0122 | 108.375 | 0 | 0.068 | 0.009 | — | |||
| 7F2 | 469.3 | 0.0184 | 175.028 | 40.747 | 0.135 | 0.019 | — | |||
| 7F3 | 454.7 | 0.0085 | 89.472 | 2.208 | 0.058 | 0.035 | — | |||
| 7F4 | 435.4 | 0.0433 | 527.259 | 144.961 | 0.421 | 0.276 | — | |||
| 7F5 | 412.8 | 0.0183 | 265.367 | 0 | 0.166 | 0.261 | — | |||
| 7F6 | 380.8 | 0.0052 | 98.571 | 0 | 0.062 | 0.63 | 0.401 | 0.440 | — | — |
| 5D4 → 7F0 | 673.9 | 0.0061 | 14.235 | 0 | 0.016 | 0.016 | 0.017 | |||
| 7F1 | 664 | 0.0089 | 21.963 | 0 | 0.025 | 0.019 | 0.020 | |||
| 7F2 | 644.6 | 0.0092 | 24.778 | 0 | 0.028 | 0.008 | 0.009 | |||
| 7F3 | 617.4 | 0.0187 | 57.674 | 14.31 | 0.082 | 0.092 | 0.092 | |||
| 7F4 | 582.3 | 0.0136 | 50.307 | 0.453 | 0.058 | 0.116 | 0.115 | |||
| 7F5 | 542.6 | 0.1047 | 485.517 | 122.756 | 0.691 | 0.578 | 0.576 | |||
| 7F6 | 488.6 | 0.0135 | 87.746 | 0 | 0.100 | 1.14 | 0.172 | 0.929 | 0.171 | 0.976 |

Fig. 5. (a) PL emission and (b) decay from the Tb3+ 5D3 excited state of 1%Tb:YTO.
Download figure:
Standard image High-resolution imageA comparison of the JO calculation with other Tb-doped single crystals is given in Table III. Tb-fluorides exhibit lower Ω2 values and longer lifetimes than Tb-oxides. The small covalency characteristic of fluorides causes the low Ω2. The Ωt values of Tb:YTO crystals are within the typical range for oxides, however, their lifetimes are relatively shorter. The Ω2 of TbAlO3 seems to be overestimated, particularly when compared with the analogous to our case Tb:YAlO3. The measured PL decay of Tb:YTO crystals in the lower concentration range is pretty close to the radiative one estimated by JO, suggesting that the emission QE of the Tb3+ center is quite high. The fluorescence QE η can be approximately estimated with the theoretical radiative decay as

Therefore, for the optimum 15%Tb:YTO, with τPL & τXRL values of 976 and 730 μs, respectively, the ηPL and ηXRL are ∼86% and 64%, respectively. It is noteworthy that the fluorescence efficiency in Tb:YTO is quite high up to the concentration quenching above 20%Tb, suggesting that the resonant energy transfer is negligible.31) From this it can be deduced that the scintillation LY has a potential improvement of about ∼36%, increasing from ∼24,000 ph/MeV to 33,000 ph MeV−1, if the non-radiative recombination centers that quench the scintillation are eliminated.
Table III. Comparison of JO parameters Ωt (t = 2, 4, and 6) (×10−20 cm2), and radiative τR and PL τPL lifetimes of Tb3+ in various crystals (* glass).
| Crystal | Ω2 | Ω4 | Ω6 | τR (ms) | τPL (ms) | References |
|---|---|---|---|---|---|---|
| 15%Tb:YTO | 6.6 | 3.5 | 3.08 | 1.14 | 0.976 | this work |
| 55%Tb:YTO | 5.7 | 3.6 | 3.07 | 1.23 | 0.286 | " |
| TTO | 5.6 | 2.8 | 2.76 | 1.3 | 0.257 | " |
| 3%Tb:30Li2O·70B2O3 * | 5.56 | 1.33 | 3.22 | — | — | 26) |
| 5%Tb:CaF2 | 1.71 | 2.65 | 2.25 | 6.77 | 6.06 | 33) |
| LiTbF4 | 1.5 | 2.23 | 2.06 | 6.8 | 3.8 | 34) |
| Tb0.81Ca0.19F2.81 | 1.14 | 1.52 | 1.82 | 6.9 | 4.2 | 34) |
| TbP5O14 | 3.77 | 1.7 | 3.43 | 3.82 | 3.4 | 35) |
| TbLiP4O12 | 3.5 | 2.43 | 1.8 | 4.09 | 3.7 | 35) |
| Ba3Tb(PO4)3 | 2.53 | 8.55 | 1.3 | 3.54 | 3.17 | 36) |
| TbAl3(BO3)4 | 8.15 | 0.29 | 2.44 | 2.07 | 0.8 | 35) |
| 7%Tb:Na3La9O3(BO3)8 | 1.05 | 11.74 | 1.59 | 2.38 | 2.02 | 37) |
| 1%Tb:KYb(WO4)2 | 0.86 | 1.66 | 1.98 | 2.08 | 0.395 | 38) |
| 0.1%Tb:YAlO3 | 3.25 | 7.13 | 2 | 2.07 | 1.71 | 39) |
| 7%Tb:Y3Al5O12 | 2.75 | 0.12 | 3.37 | 3.3 | 3.12 | 40) |
| Tb:YAlO3 | 3.49 | 5.87 | 2.55 | 2.31 | 1.72 | 41) |
| TbAlO3 | 40.52 | 8.74 | 2.26 | 3.5 | 2 | 42) |
| Tb:Lu2O3 | 3.79 | 1.3 | 1.08 | 3.02 | 1.13 | 43) |
| Tb3Sc2Al3O12 | 4.47 | 1.37 | 4.23 | — | — | 44) |
Supplementary table. Calculated line strengths S, transition probabilities A, branching ratios β, and radiative lifetimes τR of all Tb3+ energy levels for the representative 15%Tb:YTO crystal.
The present study evaluates the scintillation LY of FZ-grown Tb:YTO transparent single crystals by PAI technique. Up to 20%Tb, the LY is in the order of 24,000 ph MeV−1, i.e. ∼70% brighter than standard CWO. The measured PL decay time of the green luminescence is close to 1 ms, which is in good agreement with the theoretical estimation by JO analysis. By further comparison with the XRL decay, an LY improvement of ∼36%, reaching 33,000 ph MeV−1, is expected upon eliminating or neutralizing non-radiative recombination centers. This result proves the potential of Tb:YTO single crystals to substitute CWO in high-energy X-ray imaging applications.
Acknowledgments
The authors would like to express their sincere thanks to Dr. Yuichi Oshima for his kind help with the refractive index measurements and to Mr. Satoshi Yamamoto for his support with the polishing of various crystals.