


Abstract
We present Atacama Large Millimeter Array 850 μm continuum observations of the Orion Nebula Cluster that provide the highest angular resolution (∼0 1 ≈ 40 au) and deepest sensitivity (∼0.1 mJy) of the region to date. We mosaicked a field containing ∼225 optical or near-IR-identified young stars, ∼60 of which are also optically identified "proplyds." We detect continuum emission at 850 μm toward ∼80% of the proplyd sample, and ∼50% of the larger sample of previously identified cluster members. Detected objects have fluxes of ∼0.5–80 mJy. We remove submillimeter flux due to free–free emission in some objects, leaving a sample of sources detected in dust emission. Under standard assumptions of isothermal, optically thin disks, submillimeter fluxes correspond to dust masses of ∼0.5–80 Earth masses. We measure the distribution of disk sizes, and find that disks in this region are particularly compact. Such compact disks are likely to be significantly optically thick. The distributions of submillimeter flux and inferred disk size indicate smaller, lower-flux disks than in lower-density star-forming regions of similar age. Measured disk flux is correlated weakly with stellar mass, contrary to studies in other star-forming regions that found steeper correlations. We find a correlation between disk flux and distance from the massive star θ1 Ori C, suggesting that disk properties in this region are influenced strongly by the rich cluster environment.
1. Introduction
Protoplanetary disks are the birth-sites of planetary systems, and the properties of disks relate directly to the planets that may potentially form. In particular, disk mass constrains the mass budget for planet formation, and hence the mass distribution of planets. The minimum-mass solar nebula (MMSN) needed to form the planets in our solar system was likely between 0.01 M⊙ and 0.1 M⊙ (e.g., Weidenschilling 1977; Desch 2007).
To build giant planets on timescales shorter than inferred gas disk lifetimes (∼2–5 Myr; e.g., Fedele et al. 2010; Ingleby et al. 2012; Da Rio et al. 2014), models require initial disk masses (including both gas and solids) ≳0.01 M⊙ (e.g., Hayashi 1981; Alibert et al. 2005). Meteoritic evidence in our solar system suggests that the core of Jupiter likely formed on a much shorter timescale, <1 Myr (Desch et al. 2017; Kruijer et al. 2017). Protoplanetary disks with cleared gaps or holes around stars aged ≲1 Myr also suggest rapid formation of giant planets (e.g., ALMA Partnership et al. 2015; Dong et al. 2015; Sheehan & Eisner 2017). Higher disk masses accelerate planet formation timescales (since collision rate scales with surface density). The apparently rapid growth of >10 Earth-mass cores suggests that required initial disk masses may be on the high end of the MMSN range.
To constrain the mass of solid particles in disks, one must observe at long wavelengths. At short wavelengths (λ ≲ 10 μm), the dust in protoplanetary disks is optically thick even for solid masses <10−8 M⊙. Furthermore, longer-wavelength observations are sensitive to larger particles, and thus mass estimates are somewhat less affected by potential particle growth.
Historically, disk masses have been constrained by converting observed millimeter-wave or submillimeter-wave emission into mass under a range of assumptions (e.g., Beckwith et al. 1990). Since continuum opacity in disks is dominated by dust, investigators generally began by estimating dust masses. A key assumption is that the dust is optically thin, and so observed emission is directly correlated with the mass of solids. One must also choose dust opacities and temperatures. To compute the total, gas+dust mass, an additional assumption about the dust-to-gas ratio is required.
All of these assumptions are potentially problematic. Compact, but massive protoplanetary disks are likely to be substantially optically thick even at submillimeter wavelengths (see, e.g., Wu et al. 2017). Opacities and temperatures can vary within individual systems, and from star to star (e.g., Andrews et al. 2013). While gas-to-dust ratios are often assumed to be the ISM value of 100 for all systems, recent observations and modeling suggest this may often be incorrect (e.g., Williams & Best 2014; Eisner et al. 2016; Miotello et al. 2017).
To obtain more accurate disk masses, spatially resolved imaging is needed. If disks are resolved, we can constrain optical depth, as well as radial density and temperature profiles. Moreover, with sufficient resolution we can measure the mass within the inner ∼30 au planet-forming region, providing direct constraints on planet formation theory.
Disk masses have been well-studied previously in low-density star-forming regions (e.g., Andrews & Williams 2005, 2007; Andrews et al. 2013; Williams et al. 2013; Carpenter et al. 2014; Ansdell et al. 2015, 2016, 2017; Barenfeld et al. 2016, 2017; Pascucci et al. 2016; Law et al. 2017). Spatially resolved observations of disks in these regions have constrained relationships between protoplanetary disk and stellar properties. For example, studies of disks in the Taurus, Ophiuchus, Lupus, Chameleon 1, and Upper Sco star-forming regions have shown a dependence of disk flux on stellar mass (Andrews et al. 2013; Ansdell et al. 2016; Barenfeld et al. 2016; Pascucci et al. 2016), a relation that appears to steepen with age (Pascucci et al. 2016). Submillimeter flux also appears to correlate strongly with disk size in these regions (Tazzari et al. 2017; Tripathi et al. 2017).
Most stars in the Galaxy do not form in low-density star-forming regions. Rather, most stars form in rich clusters like the Orion Nebula (Lada et al. 1991, 1993; Carpenter 2000; Lada & Lada 2003). Isotopic abundances and dynamical signatures in our solar system suggest that it, too, may have formed in a dense, Orion-like environment (e.g., Hester & Desch 2005; Williams & Gaidos 2007; Adams 2010; Dukes & Krumholz 2012). Outflow feedback, UV radiation, stellar winds, and tidal encounters in rich clusters produce a profoundly different environment than that found in lower-density regions (e.g., Scally & Clarke 2001; Throop & Bally 2005; Adams et al. 2006; Holden et al. 2011). Expanding submillimeter continuum surveys to include rich clusters allows for the determination of protoplanetary disk properties and evolutionary timescales in typical star (and planet) formation environments.
Rich clusters are relatively challenging to observe because of their distances and high stellar density. High angular resolution and sensitivity are required. Only a handful of nearby rich clusters have been observed to date: the Orion Nebula cluster (ONC) (Mundy et al. 1995; Bally et al. 1998; Williams et al. 2005; Eisner & Carpenter 2006; Eisner et al. 2008, 2016; Mann & Williams 2009, 2010; Mann et al. 2014), IC 348 (Carpenter 2002; Cieza et al. 2015), and NGC 2024 (Eisner & Carpenter 2003; Mann et al. 2015). These existing surveys have detected very few disks with fluxes high enough to suggest ≳0.01–0.1 M⊙ of material (e.g., Eisner et al. 2008, 2016).
In this paper, we present a new 850 μm wavelength interferometric survey of the ONC with the Atacama Large Millimeter Array (ALMA). The ONC is a young, embedded stellar cluster composed of hundreds of stars spanning a broad mass range. The Trapezium region alone contains hundreds of stars within a several arcminute radius, and pre-main-sequence evolutionary models (e.g., Baraffe et al. 2015) fitted to spectroscopic and/or photometric data indicate that most stars are less than approximately one million years old (e.g., Prosser et al. 1994; Hillenbrand 1997). The high stellar density and strong UV irradiation from the Trapezium stars (θ1 Ori C in particular) produce a substantially different environment than the lower-density star-forming regions described above. We can therefore investigate here correlations of disk properties with stellar or environmental properties in this richly clustered—and hence typical—region of star and planet formation.
2. Observations and Data Reduction
We mapped the central 1 5 × 15 region of the ONC. The map is comprised of 136 mosaicked pointings. The fields were observed at ∼350 GHz frequency, corresponding to a wavelength of 850 μm. Observations were taken on 2016 September 13. We observed with four spectral windows centered at 343, 345, 355, and 358 GHz. Two windows covered 2.0 GHz bandwidth, and the other two covered 1.875 GHz.
The ALMA pipeline reduction included standard flux, passband, and gain calibrations. Sources used for calibration include J0510+1800 and J0541-0211. Because our mosaic covered a large area containing many compact sources as well as extended emission, the pipeline reduction was unable to complete the imaging process. Adopting the flux, passband, and gain calibrated data, we completed the imaging process by hand.
Substantial parts of the bandpass contained spectral line emission, which would contaminate the continuum if not taken into account. We flagged spectral channels containing strong emission in each of the observed fields. Fields including the BN/KL region or the OMC1S region contain stronger line emission and were more heavily flagged. After flagging, we split off a line-free continuum data set.
We imaged the continuum data using the CASA task tclean. We generated images with cell sizes of 002, and employed a robust weighting parameter of 0.5. We generated clean boxes using an iterative process where we placed boxes on all objects detected above 5σ, generated a cleaned image, then examined the residuals for additional detections. We made images with both Hogbom and multiscale (0, 01, and 03 scales) clean algorithms. While there is little difference in the results, the multiscale clean produced slightly lower rms and we therefore use products from that algorithm in our analysis.
We used the clean components of bright sources as a starting model for self-calibration. After applying the self-calibration solutions, the rms in the final map was improved slightly (by a few percent). We therefore use the self-calibrated data for our analysis.
Because we are interested here in protoplanetary disks with expected sizes smaller than a few hundred au, we employ a uv cut to filter out extended emission from large-scale outflows or the background molecular cloud (as done in previous work on the ONC; e.g., Felli et al. 1993a; Eisner et al. 2008). Note that the uv cut is actually applied at the same time as the inversion and cleaning described above. Eliminating large-scale emission can improve the noise in the vicinity of compact disks, but eliminating data can also degrade sensitivity. To determine the optimal balance, we generated images with uv cuts ranging from 0 (i.e., keeping all data) to 300 kλ.
The optimal rms across the mosaic is achieved with a uv cut of 100 kλ. Our final image thus uses this uv cut, along with multiscale cleaning and self-cal as described above. Finally, we applied a primary beam correction to the mosaic. Our final 850 μm continuum image is shown in Figure 1.

Figure 1. Image of the central 15 × 15 of the ONC, generated from 136 ALMA pointings at 350 GHz frequency. A 100 kλ uv cut has been employed, which substantially reduces the extended emission in the BN/KL and OMC1S regions (at the upper and lower right, respectively). As described in Section 2, larger uv cuts can eliminate more extended emission, but at the expense of overall rms; the 100 kλ cut is optimal. Circles indicate known cluster members where the flux in this image is ≥4 times the local rms noise. Blue circles represent optically identified proplyds, and red circles indicate near-IR-identified young stars. The position of θ1 Ori C is indicated with a cyan triangle.
Download figure:
Standard image High-resolution imageThe synthesized beam FWHM is 009. At the distance to Orion, ∼400 pc (e.g., Hirota et al. 2007; Kraus et al. 2007; Menten et al. 2007; Sandstrom et al. 2007; Kounkel et al. 2017), the linear resolution is approximately 35 au. The 100 kλ uv cut employed in our imaging corresponds to a spatial scale of ∼800 au. This scale is substantially larger than any of the disks imaged in our sample, and hence we have not resolved out any disk emission with this uv cut.
One of the 1.875 GHz wide windows included CO(3–2) at a rest frequency of 345.796 GHz, and another covered HCO+(4–3) at a rest frequency of 356.734 GHz. We subtracted the continuum from the line emission, and then imaged it using the same procedure as outlined above. We generated two cubes for each line: one covering 0–20 km s−1 with 0.5 km s−1 channels; and one spanning −25 to 75 km s−1 with 2 km s−1 channels. The wider-bandwidth cube is intended to map outflows and jets, while the narrower cube allows mapping of Keplerian motions in protoplanetary disks. As in previous work (Eisner et al. 2016), we detect little line emission from compact disks. While copious emission is detected from larger-scale outflows, we defer analyses of such phenomena to future work.
3. Results
We searched for 850 μm continuum emission toward the positions of HST-detected proplyds (Ricci et al. 2008) and near-IR detected sources (Hillenbrand & Carpenter 2000; Eisner et al. 2016).10
Given the positional uncertainties in the proplyd and near-IR catalogs, we require optical/near-IR and submillimeter source positions to coincide within 05. We employed a detection threshold of 4σ above the locally determined noise level for each optical/near-IR source. This threshold ensures that ≪1 detection is expected from Gaussian noise fluctuations across the entire sample of known cluster members.
Because the noise in the map is higher in the vicinity of bright, extended emission, we calculated a local noise level for each source position. In "clean" regions of the image, the rms is ∼0.1 mJy, while it rises as high as 2.5 mJy in the BN/KL region. We verified that the mean level of submillimeter background around each detected object is zero, even in the vicinity of bright extended emission (i.e., the compact disk emission does not lie on top of extended emission).
Our ALMA mosaic includes 222 near-IR-identified young stellar objects, and 61 proplyds (56 of which are also seen in the near-IR). We detected submillimeter continuum emission toward 48 of the known proplyds, a detection rate of . The detection rate among the larger sample of near-IR targets was somewhat lower, ∼50%, with submillimeter emission seen toward 102 near-IR-selected objects.

In total, submillimeter continuum emission above the 4σ level was seen toward 104 cluster members (Table 1). Of these 104 cluster members, 48 are proplyds, and 102 are near-IR-identified; i.e., two of the detected proplyds do not have known near-IR counterparts. Forty-nine of these objects were detected in previous, less sensitive observations at millimeter or submillimeter wavelengths (Mundy et al. 1995; Eisner & Carpenter 2006; Eisner et al. 2008, 2016; Mann et al. 2014). The remaining 55 objects are detected for the first time at these wavelengths. Sub-images toward each detected object are shown in Figure 2.

Download figure:
Standard image High-resolution image
Download figure:
Standard image High-resolution image
Download figure:
Standard image High-resolution image
Figure 2. Contour plots of 12 × 12 (480 × 480 au) regions around each detected source (corresponding to the circles in Figure 1). Contours are drawn at 30%, 50%, 70%, and 90% of the maximum flux in each region. The 50% contour of the synthesized beam is indicated in the bottom left corner of each image. Note that proplyds are indicated with six-digit IDs, while near-IR sources not detected as proplyds are labeled with "HC" and three digits. HC 756 and HC 757 are a close binary pair, and are included in a single sub-image.
Download figure:
Standard image High-resolution imageTable 1. Fluxes and Inferred Disk Masses for ALMA-detected Sources
| ID | α | δ | M* | Fλ 850μm | Fdust | Mdusta | Rdisk |
|---|---|---|---|---|---|---|---|
| (J2000) | (J2000) | (M⊙) | (mJy) | (mJy) | (M⊕) | (au) | |
| HC273 | 5 35 13.41 | −5 23 29.30 | ⋯ | 5.6 ± 0.4 | 5.6 ± 0.4 | 9.8 ± 0.7 | 15.1 ± 1.2 |
| HC360 | 5 35 13.53 | −5 23 4.50 | 0.10 | 2.0 ± 0.2 | 2.0 ± 0.2 | 3.5 ± 0.3 | <5 |
| HC192 | 5 35 13.59 | −5 23 55.30 | ⋯ | 12.2 ± 2.5 | 12.5 ± 4.8 | 21.8 ± 8.4 | 16.8 ± 0.7 |
| HC242 | 5 35 13.80 | −5 23 40.20 | ⋯ | 31.5 ± 0.9 | 31.5 ± 0.9 | 55.0 ± 1.6 | 15.1 ± 0.5 |
| 139-320 | 5 35 13.92 | −5 23 20.16 | 0.07 | 2.3 ± 0.2 | 2.2 ± 0.3 | 3.9 ± 0.5 | 15.4 ± 1.4 |
| 142-301 | 5 35 14.15 | −5 23 0.91 | ⋯ | 6.8 ± 0.3 | 2.5 ± 2.0 | 4.5 ± 3.5 | 37.7 ± 0.7 |
| HC361 | 5 35 14.29 | −5 23 4.30 | ⋯ | 19.9 ± 0.5 | 19.9 ± 0.5 | 34.7 ± 0.9 | 29.1 ± 0.3 |
| HC345 | 5 35 14.32 | −5 23 8.30 | 0.09 | 4.0 ± 0.2 | 4.0 ± 0.2 | 7.0 ± 0.3 | <5 |
| HC399 | 5 35 14.37 | −5 22 54.10 | ⋯ | 11.2 ± 0.4 | 11.2 ± 0.4 | 19.6 ± 0.7 | 11.8 ± 0.6 |
| HC391 | 5 35 14.39 | −5 22 55.70 | 0.18 | 1.3 ± 0.3 | 1.3 ± 0.3 | 2.3 ± 0.5 | 39.8 ± 3.2 |
| HC189 | 5 35 14.53 | −5 23 56.00 | ⋯ | 46.3 ± 1.9 | 46.3 ± 1.9 | 80.8 ± 3.3 | 43.3 ± 0.7 |
| HC364 | 5 35 14.54 | −5 23 3.70 | 0.12 | 4.2 ± 0.2 | 4.2 ± 0.2 | 7.3 ± 0.3 | <5 |
| HC276 | 5 35 14.66 | −5 23 28.70 | ⋯ | 0.7 ± 0.1 | 0.7 ± 0.1 | 1.2 ± 0.2 | 18.4 ± 4.0 |
| HC756/7 | 5 35 14.67 | −5 22 38.60 | ⋯ | 17.3 ± 2.0 | 17.3 ± 2.0 | 30.2 ± 3.5 | 45.4 ± 2.1 |
| HC411 | 5 35 14.70 | −5 22 49.40 | 0.46 | 6.7 ± 0.7 | 6.7 ± 0.7 | 11.7 ± 1.2 | 12.2 ± 1.6 |
| 147-323 | 5 35 14.72 | −5 23 23.01 | 0.50 | 6.2 ± 0.2 | 6.8 ± 0.9 | 11.9 ± 1.6 | 26.5 ± 0.6 |
| 148-305 | 5 35 14.80 | −5 23 4.76 | ⋯ | 0.7 ± 0.2 | 0.5 ± 0.3 | 0.9 ± 0.5 | 15.8 ± 4.4 |
| HC771 | 5 35 14.86 | −5 22 44.10 | ⋯ | 13.0 ± 1.3 | 13.0 ± 1.3 | 22.7 ± 2.3 | 31.8 ± 2.2 |
| HC714 | 5 35 14.88 | −5 23 5.10 | 0.38 | 4.2 ± 0.2 | 4.2 ± 0.2 | 7.3 ± 0.3 | <5 |
| 149-329 | 5 35 14.92 | −5 23 29.05 | 0.17 | 0.8 ± 0.1 | 0.7 ± 0.1 | 1.2 ± 0.2 | 22.3 ± 3.4 |
| HC334 | 5 35 15.00 | −5 23 14.30 | ⋯ | 0.7 ± 0.1 | 0.7 ± 0.1 | 1.2 ± 0.2 | <5 |
| HC398 | 5 35 15.20 | −5 22 54.40 | 1.28 | 1.2 ± 0.2 | 1.2 ± 0.2 | 2.1 ± 0.3 | 22.5 ± 4.9 |
| 152-319 | 5 35 15.20 | −5 23 18.81 | 0.10 | 2.2 ± 0.1 | 1.8 ± 0.2 | 3.2 ± 0.4 | 10.2 ± 1.5 |
| 154-324 | 5 35 15.35 | −5 23 24.11 | ⋯ | 0.6 ± 0.1 | 0.2 ± 0.2 | 0.4 ± 0.3 | 31.9 ± 4.7 |
| 154-240 | 5 35 15.38 | −5 22 39.85 | 0.19 | 6.6 ± 0.6 | 6.1 ± 1.2 | 10.7 ± 2.2 | 16.5 ± 1.8 |
| HC223 | 5 35 15.44 | −5 23 45.50 | 0.22 | 2.8 ± 0.2 | 2.6 ± 0.5 | 4.6 ± 0.9 | 7.8 ± 1.3 |
| HC413 | 5 35 15.49 | −5 22 48.60 | 0.40 | 1.5 ± 0.3 | 1.5 ± 0.3 | 2.6 ± 0.5 | 56.8 ± 4.3 |
| 155-338 | 5 35 15.51 | −5 23 37.45 | 0.47 | 16.5 ± 0.4 | 12.1 ± 3.8 | 21.0 ± 6.5 | 15.4 ± 0.2 |
| HC389 | 5 35 15.64 | −5 22 56.40 | 0.60 | 0.8 ± 0.2 | 0.7 ± 0.2 | 1.2 ± 0.4 | <5 |
| HC246 | 5 35 15.68 | −5 23 39.10 | 1.33 | 18.8 ± 0.5 | 18.8 ± 0.5 | 32.8 ± 0.9 | 19.0 ± 0.2 |
| 157-323b | 5 35 15.72 | −5 23 22.59 | 0.65 | 1.3 ± 0.2 | 0.0 ± 0.2 | 0.0 ± 0.4 | 24.2 ± 2.9 |
| 158-327 | 5 35 15.79 | −5 23 26.51 | 3.00 | 8.7 ± 0.2 | 4.4 ± 1.7 | 7.7 ± 3.0 | 13.6 ± 0.5 |
| HC336b | 5 35 15.81 | −5 23 14.30 | 18.91 | 6.6 ± 0.2 | 0.0 ± 0.3 | 0.0 ± 0.5 | 14.6 ± 0.6 |
| 158-323b | 5 35 15.83 | −5 23 22.59 | 0.61 | 5.3 ± 0.2 | 0.0 ± 0.2 | 0.0 ± 0.4 | 21.9 ± 0.9 |
| HC291b | 5 35 15.84 | −5 23 25.60 | 0.17 | 4.4 ± 0.2 | 1.5 ± 1.8 | 2.6 ± 3.1 | 14.1 ± 0.8 |
| HC342 | 5 35 15.85 | −5 23 11.00 | 5.00 | 5.0 ± 0.2 | 5.0 ± 0.2 | 8.7 ± 0.3 | 14.9 ± 0.8 |
| HC370 | 5 35 15.88 | −5 23 2.00 | ⋯ | 5.9 ± 0.2 | 6.1 ± 1.1 | 10.7 ± 1.9 | 10.6 ± 0.6 |
| HC447 | 5 35 15.89 | −5 22 33.20 | 0.08 | 1.6 ± 0.3 | 1.6 ± 0.3 | 2.8 ± 0.5 | 11.2 ± 3.4 |
| 159-338 | 5 35 15.90 | −5 23 38.00 | 0.15 | 3.6 ± 0.1 | 2.5 ± 0.9 | 4.4 ± 1.5 | 12.4 ± 0.8 |
| 159-350 | 5 35 15.96 | −5 23 50.30 | 0.60 | 44.7 ± 1.1 | 43.1 ± 8.5 | 75.3 ± 14.8 | 26.9 ± 0.2 |
| 160-353 | 5 35 16.01 | −5 23 53.00 | 0.58 | 4.8 ± 0.2 | 3.8 ± 0.9 | 6.7 ± 1.6 | <5 |
| 161-324b | 5 35 16.05 | −5 23 24.35 | ⋯ | 2.4 ± 0.2 | 0.0 ± 0.1 | 0.0 ± 0.1 | 13.8 ± 1.4 |
| HC350 | 5 35 16.06 | −5 23 7.30 | ⋯ | 4.6 ± 0.2 | 2.0 ± 0.9 | 3.5 ± 1.7 | 27.0 ± 0.8 |
| 161-328 | 5 35 16.07 | −5 23 27.81 | ⋯ | 2.7 ± 0.2 | 1.9 ± 0.4 | 3.3 ± 0.8 | 21.2 ± 1.1 |
| HC401 | 5 35 16.08 | −5 22 54.10 | 0.06 | 1.2 ± 0.2 | 1.2 ± 0.2 | 2.1 ± 0.3 | 15.1 ± 3.0 |
| 161-314 | 5 35 16.10 | −5 23 14.05 | 0.18 | 1.2 ± 0.2 | 0.9 ± 0.3 | 1.6 ± 0.6 | 25.4 ± 2.9 |
| HC354b | 5 35 16.11 | −5 23 6.80 | ⋯ | 0.7 ± 0.2 | 0.0 ± 0.1 | 0.0 ± 0.1 | 27.0 ± 0.8 |
| HC393 | 5 35 16.14 | −5 22 55.20 | 0.25 | 2.0 ± 0.2 | 2.0 ± 0.2 | 3.5 ± 0.3 | 10.6 ± 2.0 |
| 163-317b | 5 35 16.27 | −5 23 16.51 | 0.40 | 3.5 ± 0.2 | 0.0 ± 0.1 | 0.0 ± 0.1 | 16.7 ± 1.1 |
| 163-222 | 5 35 16.30 | −5 22 21.50 | 0.09 | 2.2 ± 0.3 | 2.2 ± 0.3 | 3.8 ± 0.5 | 32.3 ± 2.6 |
| 163-249 | 5 35 16.33 | −5 22 49.01 | 0.31 | 2.1 ± 0.2 | 1.9 ± 0.3 | 3.3 ± 0.6 | 13.1 ± 1.7 |
| HC171 | 5 35 16.38 | −5 24 3.40 | 0.59 | 0.9 ± 0.2 | 0.6 ± 0.3 | 1.1 ± 0.6 | 25.4 ± 5.4 |
| 165-254 | 5 35 16.54 | −5 22 53.70 | ⋯ | 1.0 ± 0.2 | 1.0 ± 0.2 | 1.7 ± 0.3 | 23.5 ± 3.5 |
| HC165 | 5 35 16.58 | −5 24 6.10 | 0.10 | 1.0 ± 0.2 | 1.0 ± 0.2 | 1.8 ± 0.3 | <5 |
| 166-316b | 5 35 16.61 | −5 23 16.19 | 0.23 | 1.2 ± 0.2 | 0.1 ± 0.2 | 0.2 ± 0.4 | 11.1 ± 2.5 |
| HC280 | 5 35 16.66 | −5 23 28.90 | ⋯ | 0.9 ± 0.1 | 0.9 ± 0.1 | 1.6 ± 0.2 | 13.8 ± 3.1 |
| 167-231 | 5 35 16.73 | −5 22 31.30 | 0.12 | 3.4 ± 0.2 | 3.4 ± 0.2 | 5.9 ± 0.3 | 26.0 ± 1.1 |
| 167-317b | 5 35 16.74 | −5 23 16.51 | 3.00 | 4.2 ± 0.2 | 0.0 ± 0.1 | 0.0 ± 0.1 | 26.4 ± 0.8 |
| 168-328 | 5 35 16.77 | −5 23 28.06 | 0.03 | 3.2 ± 0.2 | 1.4 ± 0.6 | 2.5 ± 1.0 | 13.1 ± 0.9 |
| 168-326b | 5 35 16.83 | −5 23 25.91 | ⋯ | 4.8 ± 0.2 | 0.0 ± 0.1 | 0.0 ± 0.2 | 21.5 ± 0.9 |
| HC397 | 5 35 16.91 | −5 22 55.10 | 0.12 | 2.9 ± 0.2 | 2.9 ± 0.2 | 5.1 ± 0.3 | <5 |
| 170-301 | 5 35 16.95 | −5 23 0.91 | 0.61 | 3.4 ± 0.2 | 3.4 ± 0.6 | 6.0 ± 1.0 | 12.1 ± 0.7 |
| 170-249 | 5 35 16.96 | −5 22 48.51 | 0.09 | 10.3 ± 0.3 | 11.3 ± 1.9 | 19.7 ± 3.2 | 10.7 ± 0.4 |
| HC182 | 5 35 16.96 | −5 23 59.50 | ⋯ | 2.0 ± 0.2 | 2.0 ± 0.2 | 3.5 ± 0.3 | 14.8 ± 1.9 |
| 170-337 | 5 35 16.97 | −5 23 37.15 | 0.62 | 15.3 ± 0.3 | 13.1 ± 3.0 | 22.8 ± 5.2 | 13.9 ± 0.2 |
| 171-340 | 5 35 17.04 | −5 23 39.75 | 0.45 | 17.1 ± 0.4 | 22.5 ± 2.5 | 39.4 ± 4.4 | 21.4 ± 0.2 |
| HC259 | 5 35 17.07 | −5 23 34.00 | 0.60 | 6.2 ± 0.2 | 4.4 ± 1.2 | 7.7 ± 2.2 | 11.9 ± 0.4 |
| 173-341 | 5 35 17.32 | −5 23 41.40 | 0.10 | 1.7 ± 0.1 | 1.2 ± 0.3 | 2.1 ± 0.5 | <5 |
| 173-236 | 5 35 17.34 | −5 22 35.81 | 0.71 | 14.5 ± 0.3 | 18.1 ± 2.2 | 31.6 ± 3.8 | 22.0 ± 0.2 |
| HC422 | 5 35 17.38 | −5 22 45.80 | 0.12 | 6.0 ± 0.2 | 6.0 ± 0.2 | 10.5 ± 0.3 | <5 |
| HC180 | 5 35 17.39 | −5 24 0.30 | 2.46 | 0.9 ± 0.2 | 0.9 ± 0.2 | 1.6 ± 0.3 | 20.2 ± 3.5 |
| HC313 | 5 35 17.47 | −5 23 21.10 | 0.49 | 0.6 ± 0.1 | 0.3 ± 0.2 | 0.5 ± 0.3 | 10.9 ± 4.2 |
| 175-251 | 5 35 17.47 | −5 22 51.26 | 0.35 | 2.2 ± 0.2 | 2.1 ± 0.3 | 3.7 ± 0.6 | 15.7 ± 1.7 |
| 175-355 | 5 35 17.54 | −5 23 55.05 | ⋯ | 1.2 ± 0.1 | 1.2 ± 0.1 | 2.1 ± 0.2 | 20.5 ± 2.4 |
| 176-325b | 5 35 17.55 | −5 23 24.96 | 0.48 | 2.3 ± 0.1 | 0.0 ± 0.1 | 0.0 ± 0.1 | 31.9 ± 1.2 |
| HC388 | 5 35 17.56 | −5 22 56.80 | 0.60 | 1.6 ± 0.2 | 1.6 ± 0.2 | 2.8 ± 0.3 | 17.9 ± 2.3 |
| 177-341W | 5 35 17.66 | −5 23 41.00 | ⋯ | 10.9 ± 0.3 | 2.8 ± 2.7 | 4.9 ± 4.6 | 29.5 ± 0.3 |
| HC234 | 5 35 17.77 | −5 23 42.60 | 0.14 | 1.2 ± 0.3 | 1.2 ± 0.3 | 2.1 ± 0.5 | <5 |
| HC332 | 5 35 17.82 | −5 23 15.60 | 0.39 | 2.9 ± 0.1 | 2.9 ± 0.1 | 5.1 ± 0.2 | 24.5 ± 0.9 |
| 178-258 | 5 35 17.84 | −5 22 58.15 | 0.26 | 5.7 ± 0.2 | 5.7 ± 0.2 | 10.0 ± 0.3 | 21.6 ± 0.7 |
| 179-354 | 5 35 17.96 | −5 23 53.50 | 0.04 | 1.0 ± 0.1 | 1.0 ± 0.1 | 1.7 ± 0.2 | 12.1 ± 2.6 |
| 180-331 | 5 35 18.03 | −5 23 30.80 | ⋯ | 4.4 ± 0.2 | 1.5 ± 1.0 | 2.6 ± 1.7 | 15.0 ± 0.6 |
| HC174 | 5 35 18.04 | −5 24 3.10 | 0.30 | 7.6 ± 0.3 | 7.6 ± 0.3 | 13.3 ± 0.5 | 12.4 ± 0.6 |
| 181-247 | 5 35 18.08 | −5 22 47.10 | ⋯ | 4.1 ± 0.2 | 4.7 ± 0.7 | 8.2 ± 1.2 | 15.4 ± 0.8 |
| HC177 | 5 35 18.08 | −5 24 1.20 | 0.14 | 3.1 ± 0.2 | 3.1 ± 0.2 | 5.4 ± 0.3 | 9.6 ± 1.4 |
| 182-316 | 5 35 18.19 | −5 23 31.55 | 0.35 | 3.0 ± 0.2 | 3.0 ± 0.2 | 5.2 ± 0.3 | 15.0 ± 1.0 |
| HC253 | 5 35 18.21 | −5 23 35.90 | 1.32 | 6.4 ± 0.2 | 6.4 ± 0.2 | 11.2 ± 0.3 | <5 |
| HC331 | 5 35 18.25 | −5 23 15.70 | 0.31 | 2.0 ± 0.1 | 1.6 ± 0.3 | 2.8 ± 0.5 | 13.1 ± 1.4 |
| HC436b | 5 35 18.38 | −5 22 37.50 | 0.59 | 1.8 ± 0.1 | 0.0 ± 0.1 | 0.0 ± 0.1 | 6.7 ± 1.4 |
| HC278 | 5 35 18.50 | −5 23 29.30 | 0.08 | 0.5 ± 0.1 | 0.5 ± 0.1 | 0.9 ± 0.2 | <5 |
| 187-314 | 5 35 18.68 | −5 23 14.01 | 0.61 | 0.9 ± 0.1 | 0.9 ± 0.1 | 1.6 ± 0.2 | 18.0 ± 2.8 |
| HC191 | 5 35 18.68 | −5 23 56.50 | 0.12 | 0.6 ± 0.1 | 0.6 ± 0.1 | 1.0 ± 0.2 | 4.8 ± 3.9 |
| HC713 | 5 35 18.71 | −5 22 56.90 | 1.31 | 0.8 ± 0.1 | 0.8 ± 0.1 | 1.4 ± 0.2 | 19.4 ± 3.9 |
| HC482 | 5 35 18.85 | −5 22 23.10 | 0.10 | 5.5 ± 0.3 | 5.5 ± 0.3 | 9.6 ± 0.5 | 25.2 ± 0.9 |
| 189-329 | 5 35 18.87 | −5 23 28.85 | 0.17 | 2.1 ± 0.1 | 2.0 ± 0.3 | 3.5 ± 0.5 | 11.5 ± 1.3 |
| HC352 | 5 35 18.88 | −5 23 7.20 | ⋯ | 1.7 ± 0.1 | 1.7 ± 0.1 | 3.0 ± 0.2 | <5 |
| 190-251 | 5 35 19.03 | −5 22 50.65 | 0.59 | 0.6 ± 0.1 | 0.6 ± 0.1 | 1.0 ± 0.2 | 30.6 ± 5.4 |
| 191-350 | 5 35 19.06 | −5 23 49.50 | 0.71 | 0.8 ± 0.1 | 0.4 ± 0.2 | 0.7 ± 0.3 | 15.2 ± 2.7 |
| HC351 | 5 35 19.07 | −5 23 7.50 | 0.10 | 4.1 ± 0.2 | 4.1 ± 0.2 | 7.2 ± 0.3 | 33.4 ± 0.8 |
| HC288 | 5 35 19.12 | −5 23 27.10 | 0.44 | 0.7 ± 0.1 | 0.7 ± 0.1 | 1.2 ± 0.2 | 22.0 ± 3.7 |
| 191-232 | 5 35 19.13 | −5 22 31.20 | ⋯ | 1.1 ± 0.1 | 1.1 ± 0.1 | 1.9 ± 0.2 | 34.5 ± 2.7 |
| HC366 | 5 35 19.63 | −5 23 3.60 | 0.03 | 4.7 ± 0.2 | 4.7 ± 0.2 | 8.2 ± 0.3 | 9.9 ± 0.9 |
| 198-222 | 5 35 19.82 | −5 22 21.55 | ⋯ | 2.6 ± 0.3 | 2.7 ± 0.5 | 4.7 ± 0.9 | 15.3 ± 2.8 |
Notes. Stellar masses, where available, are taken from a new study by M. Fang et al. (2018, in preparation), and from the literature (Hillenbrand 1997; Luhman et al. 2000; Slesnick et al. 2004; Hillenbrand et al. 2013; Ingraham et al. 2014). Disk sizes are HWHM major axes of Gaussian fits, after deconvolution of the synthesized beam. All uncertainties listed in the table are 1σ errors.
aDust masses are computed from the measured dust fluxes using Equation (1) and assuming Tdust = 20 K. These masses are not accurate (see Figure 13 and the discussion in Section 4.5), and are listed only to give a rough idea of how flux and mass are related. bAfter removal of free–free emission, the dust masses for these objects are consistent with zero. While they were detected with ALMA, the detection traces free–free emission, and no significant emission from dust is detected.In Table 2, we list the cluster members not detected above 4σ in our ALMA map. For each source, we give the optical/IR source position, and the 4σ upper limit computed from the local rms noise level.
Table 2. Upper Limits for Nondetected Sources
| ID | α | δ | Fλ850μm |
|---|---|---|---|
| (J2000) | (J2000) | (mJy) | |
| HC190 | 5 35 13.23 | −5 23 55.50 | <10.0 |
| HC301 | 5 35 13.26 | −5 23 22.80 | <1.3 |
| HC380 | 5 35 13.29 | −5 22 57.90 | <1.7 |
| 133-353 | 5 35 13.30 | −5 23 53.05 | <8.3 |
| HC471 | 5 35 13.37 | −5 22 26.20 | <9.6 |
| HC198 | 5 35 13.38 | −5 23 53.20 | <7.8 |
| HC240 | 5 35 13.45 | −5 23 40.40 | <4.2 |
| HC266 | 5 35 13.53 | −5 23 30.90 | <1.4 |
| HC178 | 5 35 13.55 | −5 23 59.70 | <14.6 |
| HC222 | 5 35 13.68 | −5 23 45.40 | <11.6 |
| HC483 | 5 35 13.75 | −5 22 22.00 | <11.2 |
| HC254 | 5 35 13.86 | −5 23 35.00 | <1.5 |
| HC451 | 5 35 13.97 | −5 22 31.90 | <8.4 |
| HC247 | 5 35 14.05 | −5 23 38.50 | <2.0 |
| HC438 | 5 35 14.09 | −5 22 36.60 | <7.8 |
| HC458 | 5 35 14.31 | −5 22 30.70 | <11.0 |
| HC448 | 5 35 14.36 | −5 22 32.80 | <21.5 |
| HC439 | 5 35 14.37 | −5 22 36.10 | <8.8 |
| HC300 | 5 35 14.40 | −5 23 23.10 | <0.5 |
| HC258 | 5 35 14.40 | −5 23 33.70 | <0.8 |
| HC759 | 5 35 14.50 | −5 22 29.40 | <28.2 |
| HC784 | 5 35 14.50 | −5 22 38.78 | <8.2 |
| HC193 | 5 35 14.53 | −5 23 55.10 | <7.5 |
| HC209 | 5 35 14.57 | −5 23 50.80 | <6.5 |
| HC443 | 5 35 14.66 | −5 22 33.80 | <11.0 |
| HC369 | 5 35 14.67 | −5 23 1.90 | <0.7 |
| HC755 | 5 35 14.71 | −5 22 35.50 | <8.8 |
| HC464 | 5 35 14.73 | −5 22 29.80 | <15.9 |
| HC220 | 5 35 14.82 | −5 23 46.50 | <1.6 |
| HC773 | 5 35 14.82 | −5 22 23.20 | <10.5 |
| HC324 | 5 35 14.84 | −5 23 16.00 | <0.5 |
| HC453 | 5 35 14.87 | −5 22 31.70 | <10.4 |
| HC431 | 5 35 14.92 | −5 22 39.10 | <6.5 |
| HC245 | 5 35 14.95 | −5 23 39.30 | <0.8 |
| 150-231 | 5 35 15.02 | −5 22 31.11 | <7.2 |
| HC195 | 5 35 15.04 | −5 23 54.50 | <2.0 |
| HC373 | 5 35 15.04 | −5 23 1.10 | <0.6 |
| HC298 | 5 35 15.07 | −5 23 23.40 | <0.5 |
| HC219 | 5 35 15.16 | −5 23 46.70 | <1.1 |
| HC359 | 5 35 15.18 | −5 23 5.00 | <0.6 |
| HC437 | 5 35 15.21 | −5 22 36.70 | <5.0 |
| HC478 | 5 35 15.21 | −5 22 24.10 | <7.1 |
| HC211 | 5 35 15.25 | −5 23 49.80 | <1.1 |
| HC386 | 5 35 15.27 | −5 22 56.70 | <0.8 |
| HC299 | 5 35 15.30 | −5 23 23.20 | <0.5 |
| HC310 | 5 35 15.35 | −5 23 21.40 | <0.5 |
| HC476 | 5 35 15.35 | −5 22 25.20 | <5.3 |
| 154-225 | 5 35 15.37 | −5 22 25.35 | <5.0 |
| HC261 | 5 35 15.38 | −5 23 33.40 | <0.5 |
| HC327 | 5 35 15.54 | −5 23 15.80 | <0.6 |
| HC419 | 5 35 15.55 | −5 22 46.40 | <1.2 |
| HC274 | 5 35 15.56 | −5 23 29.60 | <0.5 |
| HC378 | 5 35 15.60 | −5 22 58.90 | <0.6 |
| HC172 | 5 35 15.62 | −5 24 3.10 | <1.3 |
| HC236 | 5 35 15.70 | −5 23 41.90 | <0.5 |
| HC248 | 5 35 15.76 | −5 23 38.40 | <1.7 |
| HC344 | 5 35 15.77 | −5 23 9.90 | <0.7 |
| 158-326 | 5 35 15.81 | −5 23 25.51 | <0.9 |
| HC340 | 5 35 15.81 | −5 23 12.00 | <0.8 |
| HC420 | 5 35 15.84 | −5 22 45.90 | <0.8 |
| HC769 | 5 35 15.96 | −5 22 41.10 | <0.8 |
| HC304 | 5 35 15.97 | −5 23 22.70 | <0.8 |
| HC303 | 5 35 16.10 | −5 23 23.20 | <0.6 |
| HC768 | 5 35 16.14 | −5 22 45.10 | <0.8 |
| HC435 | 5 35 16.20 | −5 22 37.50 | <0.8 |
| HC758 | 5 35 16.24 | −5 22 24.30 | <1.0 |
| HC317 | 5 35 16.24 | −5 23 19.10 | <0.6 |
| HC479 | 5 35 16.31 | −5 22 24.00 | <1.0 |
| HC292 | 5 35 16.35 | −5 23 25.30 | <0.6 |
| HC485 | 5 35 16.38 | −5 22 22.30 | <1.0 |
| HC341 | 5 35 16.41 | −5 23 11.50 | <0.5 |
| HC309 | 5 35 16.46 | −5 23 23.00 | <0.6 |
| 165-235 | 5 35 16.48 | −5 22 35.16 | <0.8 |
| HC390 | 5 35 16.49 | −5 22 56.50 | <0.6 |
| 166-406 | 5 35 16.57 | −5 24 6.00 | <1.0 |
| 166-250 | 5 35 16.59 | −5 22 50.36 | <0.7 |
| HC293 | 5 35 16.73 | −5 23 25.20 | <0.7 |
| HC170 | 5 35 16.77 | −5 24 4.30 | <0.9 |
| 168-235 | 5 35 16.81 | −5 22 34.71 | <0.8 |
| HC235 | 5 35 16.84 | −5 23 42.30 | <0.4 |
| HC349 | 5 35 16.87 | −5 23 7.10 | <0.5 |
| 169-338 | 5 35 16.88 | −5 23 38.10 | <1.2 |
| HC484 | 5 35 16.90 | −5 22 22.50 | <0.9 |
| HC441 | 5 35 16.91 | −5 22 35.20 | <0.7 |
| HC450 | 5 35 17.01 | −5 22 33.10 | <0.7 |
| HC410 | 5 35 17.12 | −5 22 50.10 | <1.0 |
| HC315 | 5 35 17.16 | −5 23 20.40 | <0.5 |
| HC330 | 5 35 17.24 | −5 23 16.60 | <0.5 |
| HC493 | 5 35 17.34 | −5 22 21.20 | <0.9 |
| 174-305 | 5 35 17.37 | −5 23 4.86 | <0.5 |
| HC237 | 5 35 17.41 | −5 23 41.80 | <0.5 |
| HC469 | 5 35 17.58 | −5 22 27.80 | <0.6 |
| 176-252 | 5 35 17.64 | −5 22 51.66 | <0.7 |
| 177-341E | 5 35 17.73 | −5 23 41.10 | <1.0 |
| HC333 | 5 35 17.74 | −5 23 14.90 | <0.5 |
| HC462 | 5 35 17.76 | −5 22 31.00 | <0.5 |
| HC230 | 5 35 17.79 | −5 23 44.20 | <0.5 |
| HC367 | 5 35 17.87 | −5 23 3.10 | <0.5 |
| HC425 | 5 35 17.95 | −5 22 45.50 | <0.6 |
| HC256 | 5 35 17.97 | −5 23 35.50 | <0.4 |
| HC372 | 5 35 18.08 | −5 23 1.80 | <0.5 |
| HC221 | 5 35 18.21 | −5 23 46.30 | <0.4 |
| HC348 | 5 35 18.28 | −5 23 7.50 | <0.5 |
| 183-405 | 5 35 18.33 | −5 24 4.85 | <1.0 |
| HC430 | 5 35 18.40 | −5 22 40.00 | <0.4 |
| HC185 | 5 35 18.51 | −5 23 57.80 | <0.6 |
| HC765 | 5 35 18.53 | −5 23 47.90 | <0.4 |
| HC384 | 5 35 18.53 | −5 22 58.10 | <0.6 |
| HC463 | 5 35 18.58 | −5 22 31.00 | <0.5 |
| HC311 | 5 35 18.97 | −5 23 22.00 | <0.4 |
| HC357 | 5 35 19.11 | −5 23 6.30 | <0.7 |
| HC444 | 5 35 19.14 | −5 22 34.60 | <0.5 |
| HC408 | 5 35 19.22 | −5 22 50.70 | <0.6 |
| HC356 | 5 35 19.38 | −5 23 6.50 | <0.6 |
| HC491 | 5 35 19.47 | −5 22 21.80 | <1.0 |
| HC728 | 5 35 19.51 | −5 23 39.70 | <0.6 |
| HC188 | 5 35 19.62 | −5 23 57.30 | <0.8 |
| HC446 | 5 35 19.68 | −5 22 34.20 | <0.7 |
| HC210 | 5 35 19.86 | −5 23 51.60 | <1.0 |
| HC176 | 5 35 19.93 | −5 24 2.60 | <1.4 |
| HC452 | 5 35 19.98 | −5 22 32.80 | <1.4 |
| HC766 | 5 35 20.00 | −5 23 28.80 | <1.4 |
| HC474 | 5 35 20.03 | −5 22 26.50 | <1.6 |
Note. These are 4σ limits, where the rms is calculated locally toward each source position.
Given the strong ionization field near the Trapezium stars, gas in circumstellar disks or outflows can emit free–free emission. Contributions of submillimeter-wavelength free–free emission must be quantified to accurately determine the flux arising from dusty disk matter. The spectrum of optically thin free–free emission is relatively flat compared to that of dust emission, and so observations at centimeter wavelengths can be used to constrain free–free emission (e.g., Eisner et al. 2008; Sheehan et al. 2016).
We used previous observations of the ONC at centimeter wavelengths (Felli et al. 1993a, 1993b; Zapata et al. 2004; Forbrich et al. 2007, 2016; Sheehan et al. 2016) to search for free–free emission from our sample. These surveys used the VLA, and have angular resolution comparable to the resolution in our ALMA observations. The more recent of these surveys have the sensitivity required to constrain free–free emission at the same flux levels seen in our ALMA map. Fifty-two of the sources detected in our ALMA observations are also seen in these previous observations.
For the 52 targets detected previously at centimeter wavelengths, we constructed a model that includes optically thick free–free emission past a turnover wavelength (typically >1–10 cm), thin free–free emission short-ward of that turnover, and optically thin dust with β = 1 (as in Eisner et al. 2016). Free parameters in the model are the turnover wavelength of free–free emission, and the free–free and dust fluxes at the observed ALMA wavelength. Best-fit models are shown in Figure 3.

Download figure:
Standard image High-resolution image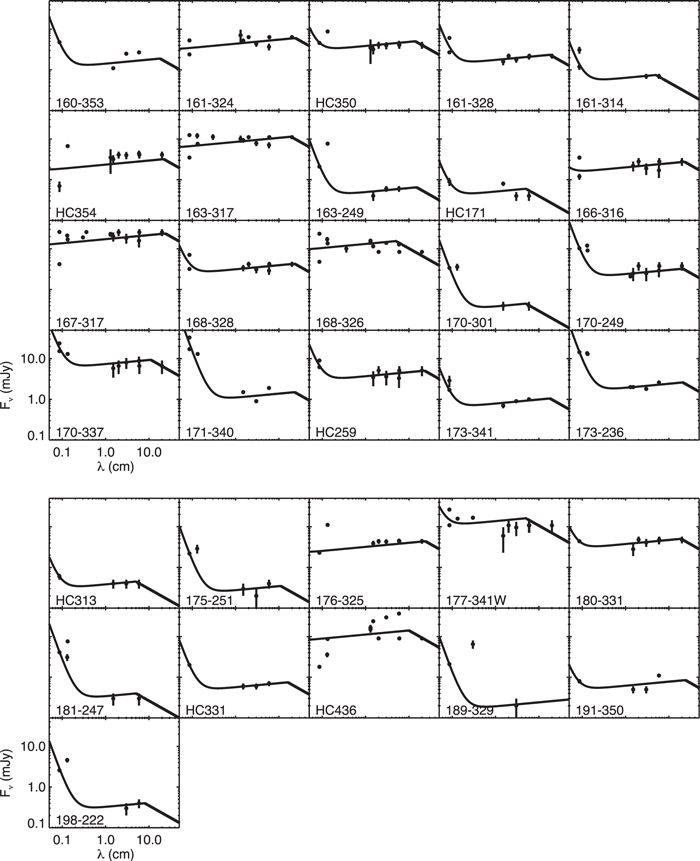
Download figure:
Standard image High-resolution image
Figure 3. Long-wavelength fluxes for ONC cluster members detected in our ALMA observations (points with 1σ error bars), and best-fit models including free–free and dust emission (curves). Error bars are smaller than the plotted symbols in some cases.
Download figure:
Standard image High-resolution imageThere are a few objects in Figure 3 for which the best-fit models do not fully capture the scatter in the photometric data. Examples include HC 192 and 198–222. The scatter in the photometry for these sources probably reflects intrinsic variability (which has been seen previously; e.g., Felli et al. 1993b; Zapata et al. 2004; Kounkel et al. 2014; Rivilla et al. 2015; Sheehan et al. 2016). If the variable emission arises from dust and ionized gas, then our use of all photometry in the fits ensures the scatter in the data is reflected in the error bars listed in Table 1. However, our model does not include potential contributions from gyrosynchroton emission, which may cause (some of) the large-amplitude radio variability in a small fraction of ONC members (e.g., Sheehan et al. 2016).
The remaining objects detected in our ALMA mosaic are not seen in centimeter-wavelength observations. These nondetections imply that the centimeter-wavelength flux, and hence the potential free–free contribution at millimeter wavelengths, is ≲0.03 mJy for these sources. Since the observed ALMA fluxes are all ≥0.5 mJy, we can be confident that we have detected dust emission. The ≲0.03 mJy uncertainties resulting from potential low-level free–free emission are much smaller than the uncertainties in the millimeter-wavelength flux measurements.
We plot a histogram of measured fluxes, corrected for free–free contributions, in Figure 4. Free–free corrected fluxes are also listed in Table 1. Figure 4 includes only dusty disks; i.e., sources for which the submillimeter flux can be attributed purely to free–free emission are excluded. The distribution of corrected fluxes is strongly peaked around ∼0.5 mJy. This flux is close to the 4σ detection limit, which is mJy across the mosaic.


Figure 4. Left: the distribution of measured 350 GHz (λ850 μm) continuum fluxes for detected objects, after subtraction of contributions from free–free emission. We also include an additional axis label indicating the masses corresponding to these fluxes, calculated using Equation (1). The assumptions inherent in Equation (1) are almost certainly incorrect for this sample (see Section 4.5), and the masses are listed here to provide a point of reference only. Right: the distribution of fluxes <10 mJy for detected objects.
Download figure:
Standard image High-resolution imageThe ≈009 (35 au) angular resolution of our observations is sufficient to constrain sizes of detected disks. To measure sizes, we fitted a 2D elliptical Gaussian to each of the sub-images shown in Figure 2. We used Gaussian deconvolution to remove the effect of the beam. Even though the beam has an FWHM of ∼40 au, objects with intrinsic FWHM ≳10 au lead to sources that are resolved, since a 10 au source convolved with a 40 au beam yields an "observed" image with FWHM larger than 40 au. Thus, objects in our sample where the fitted size is comparable to that of the beam are considered to have intrinsic FWHM < 10 au (i.e., HWHM < 5 au).
Beam-deconvolved disk radii (HWHM of the major axis of 2D Gaussians) are listed in Table 1. Of the 104 detected sources, all but 15 are spatially resolved. In Figure 5, we show a histogram of disk sizes for dusty disks. These are sources with nonzero dust emission (i.e., excluding those sources in Table 1 for which 100% of the flux is attributed to free–free emission). The distribution is peaked around disk radii of ∼10–30 au, with few disks of radii larger than 35 au.

Figure 5. Distribution of disk sizes for our sample of dusty disks. These radii represent the HWHM major axes of Gaussian fits to images of each detected object (shown in Figure 2). The lowest-radius bin includes the 15 unresolved objects, which have radii ≲5 au.
Download figure:
Standard image High-resolution image4. Discussion
4.1. Disk Detection Rates
The detection rate among optical and near-IR-selected cluster members that lie within the ALMA mosaic is ∼50%, lower than the detection rate of ∼80% for only the HST-identified proplyds. A similar discrepancy has been seen in previous work, albeit with smaller numbers of detections (e.g., Eisner et al. 2016).
Since we are interested primarily in sources with significant dust emission, rather than objects where free–free emission is found above the detection threshold of our observations, we first examine the detection rate of dusty disks. Of the 104 detected objects listed in Table 1, 12 are consistent with 100% of the submillimeter continuum flux arising from free–free emission. Of these, 8 are HST-identified proplyds. Removing these free–free-dominated sources from the sample, the detection rate of dusty disks in the proplyd sample is ∼65%. In the larger sample of cluster members, dusty disks are detected around ∼45% of sources.
Given the sample size, the discrepancy between the proplyd sample and the larger near-IR sample (or, by extension, the non-proplyd component of the near-IR sample) is marginally statistically significant. 65 ± 10% of proplyds have dusty disks, while 45 ± 7% of all cluster members in the region have dusty disks.
One possible explanation for the higher detection rate among the proplyd sample is that some of the near-IR sample are not bona fide ONC cluster members. Since proplyds typically have spatially resolved, disk-like morphologies, one does not expect contamination of that sample by background objects. While some background or foreground source contamination of the near-IR-selected sample is possible, Hillenbrand & Carpenter (2000) estimate that <5% of objects are contaminants.
A similar, alternative explanation, is that the near-IR sample may simply be less likely to have massive disks. The imaging-selected proplyd sample is likely to contain large, and hence massive disks. While H − K excess from the near-IR-selected sample suggests the presence of disks around nearly all objects (Hillenbrand & Carpenter 2000), there is no a priori reason to expect these disks to be large.
In any event, the detection of dusty disks around ≳45% of ONC cluster members suggests that we are probing close to the peak of the disk mass distribution with the sensitivity achieved in our observations. Most detected sources have 850 μm continuum fluxes around 0.5 mJy, which is close to our detection threshold. Thus, we expect the disk detection rate to increase with any increase in the sensitivity of future observations.
4.2. Disk Size Distribution
The disks in the ONC appear to be compact in comparison with disks in other regions. Disk sizes have been measured in several low-density star-forming regions, some with ages similar to the ∼1 Myr age of the ONC, and some with substantially older ages. We consider Taurus, Ophiuchus, Lupus, Cham I, and Upper Sco, which have inferred ages of 1–2 Myr, 1–2 Myr, 1–3 Myr, 2–3 Myr, and 10 Myr, respectively (see Pascucci et al. 2016, and references therein).
In Figure 6, we show the cumulative probability density function for disk size in the ONC and other regions. For the ONC, we compute disk radius as a Gaussian HWHM. The same quantity is calculated for Cham I (Pascucci et al. 2016), Taurus, and Ophiuchus (Tripathi et al. 2017). In Lupus and Upper Sco, the inferred radius is the exponential cutoff radius of a power-law disk (Barenfeld et al. 2017; Tazzari et al. 2017). While this quantity may differ slightly from disk HWHM, the difference is likely smaller than a factor of two (e.g., Eisner et al. 2004). The discrepancies in size distributions between the ONC and other regions are considerably larger than this uncertainty. Furthermore, while different surveys obtained different sensitivities and angular resolutions, all were capable of detecting the largest disks, which are clearly lacking in the ONC.

Figure 6. Disk size cumulative distribution for the ONC compared with previous work in Taurus and Ophiucus (Tripathi et al. 2017), Lupus (Tazzari et al. 2017), Cham I (Pascucci et al. 2016), and Upper Sco (Barenfeld et al. 2017). The distributions and the 1σ confidence intervals (shaded regions) were calculated using the Kaplan–Meier estimator in order to account for upper limits in the samples (e.g., Lavalley et al. 1992). Since unresolved disks are included as censored data, the distributions do not always reach unity. While disk size is quantified via Gaussian HWHM for the ONC, Cham I, Taurus, and Oph, in Lupus and Upper Sco the radius is computed as the exponential cutoff radius of a power-law disk.
Download figure:
Standard image High-resolution imageIn the younger regions, Taurus, Ophiuchus, and Lupus, disk sizes are substantially larger than the distribution observed in the ONC. In the older Cham I and Upper Sco regions, many compact disks are observed, similar to the disks seen in the ONC. However, Upper Sco contains a number of disks with inferred sizes substantially larger than anything seen in the ONC sample.
In Figure 7, we plot measured disk radius versus submillimeter flux for our ALMA ONC sample. We applied linear regression using the Bayesian analysis described in Kelly (2007). This technique takes into account heteroscedastic error bars on both parameters of interest and uses available upper limits to constrain the regression.

Figure 7. Fitted disk radius (HWHM) vs. submillimeter flux for the dusty disks detected in our ONC map (see Table 1). Unresolved sources are indicated as upper limits. We performed a linear regression to these data, including uncertainties and upper limits, using the method of Kelly (2007). The median of the posterior distribution is indicated with a dotted line, and the 1σ confidence interval is shown as a gray shaded region. The correlation is only marginally statistically significant in this case: log (HWHM/au) = (1.1 ± 0.2) + (0.09 ± 0.07) log (Flux/mJy). The dashed line indicates the relationship determined by Tripathi et al. (2017) in low-density star-forming regions: HWHM = 160Lmm0.5, where Lmm is the 850 μm flux in jansky, scaled to a distance of 140 pc. This trend lies outside of the 1σ region of the posterior distribution of the ONC data regression. To use another metric, the trend from Tripathi et al. (2017) has more than four times larger χ2 residuals than the median of the posterior distribution from the regression to the ONC data.
Download figure:
Standard image High-resolution imageWhile no statistically significant trend is seen, we do exclude any steep dependence of disk size on dust mass. Thus, allowed slopes for the ONC sample are shallower than the relation derived for lower-density regions (Tazzari et al. 2017; Tripathi et al. 2017). However, it is worth noting that the flux-size data in lower-density regions span a larger range of submillimeter flux and disk size, and hence have a better lever with which to determine the slope.
The compact size distribution of ONC disks means that the submillimeter fluxes in Table 1 correspond to dust emission from potentially planet-forming zones. Indeed, it may be that the ∼30 au radius of our own solar system is related to the original size of the protosolar nebula set by the external environment.
We can obtain a rough estimate of the scale set by photoevaporation by considering the gravitational radius, . At larger stellocentric radii, the sound speed exceeds the escape velocity, and photoevaporation causes mass loss. Assuming a 0.3 M⊙ star (typical for the ONC; e.g., Hillenbrand 1997), and a sound speed of 5 km s−1 (e.g., Henney & O'Dell 1999), the gravitational radius is ∼20 au, similar to the disk radii inferred for our sample.

Many of the proplyds in our sample have disk radii measured in the optical with HST (Vicente & Alves 2005). The optical source sizes are typically larger than the submillimeter emission by a factor of a few. Most optical measurements of proplyds trace ionization fronts, and hence we expect them to be larger than dense, dusty disks traced by submillimeter emission. However, even silhouette disks are larger in the optical, presumably because even tenuous columns of dust can become optically thick at optical wavelengths. In future work, we intend to model all available, multi-wavelength, spatially resolved images simultaneously, to better constrain disk sizes and dust properties (see Section 4.5 for further discussion).
4.3. Disk Photoevaporation
The lack of disks with radii larger than 50 au in our ONC sample is striking in comparison with low-density star-forming regions. We suggest that this difference is due to the rich cluster environment in the ONC. Since external evaporation tends to strip outer disk material more easily (e.g., Johnstone et al. 1998), the massive Trapezium stars likely truncate the disk size distribution.
One might expect to see some dependence of disk size or flux with (projected) distance from θ1 Ori C, since disks in the cluster outskirts would be less affected by photoionizing radiation. However, the crossing time within a fraction of a parsec is substantially shorter than the age of the region. Indeed, the short disk lifetimes suggested by inferred photoevaporation rates for free–free-dominated sources argue that these objects have not been close to the Trapezium stars for longer than 104–105 years (e.g., Bally et al. 1998). Thus, cluster kinematics may dilute any underlying effects caused by (current) proximity to the Trapezium cluster.
Previous observations found that sources within 0.03 pc of θ1 Ori C seem to have a truncated submillimeter flux distribution with respect to disks at larger cluster radii (Mann & Williams 2009, 2010; Mann et al. 2014; Eisner et al. 2016). Figure 8 shows submillimeter flux plotted against distance from θ1 Ori C for our current study. The observations presented here confirm the lack of high-submillimeter-flux sources within 0.03 pc. These disks, with lower submillimeter fluxes, are within the EUV-dominated regime of θ1 Ori C, where intense ionizing radiation likely photoevaporated the outer disks of these objects (e.g., Johnstone et al. 1998).

Figure 8. Left: submillimeter flux for dusty disks vs. projected distance from θ1 Ori C, along with the best-fit linear regression and 1σ confidence region. We see a paucity of disks with higher submillimeter fluxes within 0.03 pc of θ1 Ori C (as seen in previous studies; Mann et al. 2014; Eisner et al. 2016). Flux also correlates with distance to the Trapezium over the entire range of cluster radii probed here. The regression suggests log (Flux/mJy) = (0.80 ± 0.45) + (0.30 ± 0.25) log (Distance/pc). Right: the same plot, but including all cluster members in the region, both detections and nondetections (either from Table 2 or free–free-dominated sources in Table 1). We treat these nondetections as censored data when performing the regression. The fitted trend is log (Flux/mJy) = (0.27 ± 0.25) + (0.45 ± 0.20) log (Distance/pc), consistent with (but more significant than) the trend in the left panel.
Download figure:
Standard image High-resolution imageWe find a marginally significant correlation between observed submillimeter flux and cluster radius over the decade or so of projected distances from θ1 Ori C probed with our sample. While EUV radiation likely dominates within 0.03 pc, FUV radiation from θ1 Ori C is responsible for disk photoevaporation at larger cluster radii. Figure 8 indicates that this FUV radiation leads to lower-mass disks at smaller cluster radii. This behavior is easily explained if external disk photoevaporation from θ1 Ori C is stripping disk matter. At greater distances, the FUV flux decreases and hence the photoevaporation rate is lower. It is also possible that tidal stripping of disks by stellar encounters, which occurs more frequently in the denser inner regions, contributes to the observed trend.
Disks that suffer more photoevaporation should also be smaller, since matter at larger stellocentric radii is less tightly bound to the system and hence more easily stripped. Figure 9 shows that our observations are consistent with increasing disk size with cluster radius, though we do not constrain the relationship with high significance. Note that even very close to θ1 Ori C, the inner disks can survive (since the gravitational radius is ≳1 au), and hence near-IR excess would still be observed (see, e.g., Richert et al. 2015).

Figure 9. Radii (HWHM) of dusty disks vs. projected distance from θ1 Ori C. We see a trend of size with cluster radius, (Radius/au) = (Distance/pc).

Download figure:
Standard image High-resolution image4.4. Disk Properties As a Function of Stellar Mass
Previous investigations of near-IR excess emission showed the inner disk fraction for stars in Orion to be largely independent of stellar age and mass, although there may be a paucity of disks around very massive stars (Hillenbrand et al. 1998; Lada et al. 2000). However, this correlation has not been well-studied in the ONC for massive disks as traced by millimeter/submillimeter emission.
Observations of Taurus and other low-density star-forming regions suggest a significant correlation between disk and stellar mass (Andrews et al. 2013; Ansdell et al. 2016; Barenfeld et al. 2016; Pascucci et al. 2016). With our ONC sample, we can explore whether or not submillimeter flux correlates with stellar mass in the same way seen in these lower-density star-forming regions.
Stellar masses, determined spectroscopically, are available in the literature for about 60% of our ALMA-detected sample (Hillenbrand 1997; Luhman et al. 2000; Slesnick et al. 2004; Hillenbrand et al. 2013; Ingraham et al. 2014). Our group has also been determining stellar masses for these and additional cluster members using optical/near-IR spectroscopy (M. Fang et al. 2018, in preparation). These new measurements are done in a uniform way, using updated evolutionary tracks (here we adopt those of Baraffe et al. 2015). We use these instead of previous measurements where possible, and supplement with stellar masses from the literature when new measurements are not available. We verify that the analysis below gives consistent results with and without these supplemental measurements. We have stellar mass measurements for of our submillimeter detections (Table 1), and 65% of nondetected sources (Table 2).

We plot the submillimeter flux of detected sources (after removal of free–free emission) versus stellar mass for this subsample in Figure 10. In the right panel of Figure 10, we make the same plot but include nondetected sources. A weak correlation of submillimeter flux and stellar mass is seen.

Figure 10. Observed submillimeter flux from dusty disks plotted as a function of stellar mass. Stellar masses are taken primarily from M. Fang et al. (2018, in preparation), who applied the evolutionary tracks of Baraffe et al. (2015) to luminosities and effective temperatures determined from optical/near-IR spectra. Only objects for which stellar masses have been determined are included, and we restrict our attention to (the vast majority of) stars less massive than 5 M⊙. We assume that stellar masses are uncertain by 20%. In the right panel, we plot the same quantities, but include nondetected sources. Regressions are shown for each panel, and the results are consistent. When we include nondetections, the fitted trend is log (Flux/mJy) = (−0.06 ± 0.30) + (0.25 ± 0.15) log (M*/M⊙). For comparison, we also show the relationships inferred for Taurus under different assumptions (Andrews et al. 2013; Pascucci et al. 2016; Ward-Duong et al. 2018) as dashed lines in each panel.
Download figure:
Standard image High-resolution imageIn contrast to our ONC results, in lower-density star-forming regions, a steeper trend is seen between disk flux and stellar mass (e.g., Pascucci et al. 2016). In Figure 10, we plot the stellar mass-disk flux relationship for Taurus, which, depending on assumptions made, has a log–log slope varying from linear to 1.6 (Andrews et al. 2013; Pascucci et al. 2016; Ward-Duong et al. 2018). Even a linear slope is significantly steeper than allowed by the ONC data. In Lupus, Cham I, and Upper Sco, the relationship is even steeper than Taurus.
We also find a marginally significant (∼2σ) correlation of disk size and stellar mass (Figure 11). Disks around higher-mass stars tend to have larger radii. This may reflect an intrinsic relationship between disk size and stellar mass, or it may result from the interplay between external photoevaporation and the gravitational binding energy of the star. Since the gravitational radius is , photoevaporation will strip disks around lower-mass stars to smaller stellocentric radii.

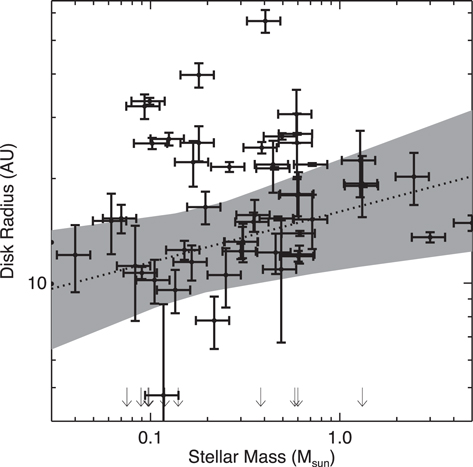
Figure 11. Disk size (HWHM) for dusty disks as a function of stellar mass. A linear regression to the data shows a positive correlation: log (Radius/au) = (1.2 ± 0.2) + (0.15 ± 0.07) log (M*/M⊙).
Download figure:
Standard image High-resolution image4.5. Disk Mass Distribution
Historically, disk masses have been inferred from millimeter and submillimeter-wavelength observations under the assumption of optically thin dust. Since dust opacity tends to decrease with increasing wavelength (e.g., Miyake & Nakagawa 1993), disks are more likely to be optically thin in the submillimeter and millimeter regime than at shorter wavelengths. At even longer, radio wavelengths, lower dust emissivity makes detection difficult, and free–free emission from ionized gas can dominate. Thus, the submillimeter is the "sweet spot" for measurements of dust continuum emission.
Assuming optically thin dust, continuum fluxes (less free–free contributions) can be converted to disk dust masses:

Here, ν is the observed frequency, Sν,dust is the observed flux due to cool dust, d is the distance to the source, is the dust mass opacity, Tdust is the dust temperature, and Bν is the Planck function.11 To use this formula, we make the following assumptions: d = 400 pc; κ0 = 2 cm2 g−1 at 1.3 mm; β = 1.0 (Hildebrand 1983; Beckwith et al. 1990); and Tdust = 20 K (e.g., Carpenter 2002; Andrews & Williams 2005; Williams et al. 2005).

As we discuss further below, the average disk temperature is somewhat uncertain. Andrews et al. (2013) argue that Tdust should be a function of host star type, and they find that 20 K is appropriate for M stars, which are the dominant stellar constituent of the ONC (e.g., Hillenbrand 1997). Furthermore, Tazzari et al. (2017) finds that 20 K is consistent with detailed radiative transfer modeling of disks around low-mass stars in Lupus. However, these studies typically dealt with large disks, and smaller disks will have higher average dust temperatures (e.g., Hendler et al. 2017). External heating from massive stars may also lead to higher average disk temperatures (e.g., Ricci et al. 2017).
Using this formula with Tdust = 20 K, we convert the measured 850 μm fluxes into dust masses, and include these in Table 1 and Figure 4. The vast majority of detections have dust disk masses ≲1 M⊕. As a point of reference, giant planet cores likely have masses ≳10 M⊕ (e.g., Pollack et al. 1996), and thus disks with only 1 M⊕ of solids would be unable to form Jupiter-like planets.
We compare the simply derived masses listed in Table 1 with those in other star-forming regions. Mass distributions, computed in the same way, are available for Taurus (Andrews et al. 2013), Lupus (Ansdell et al. 2016), Cham I (Pascucci et al. 2016), σ Ori (Ansdell et al. 2017), and Upper Sco (Barenfeld et al. 2016). As noted in Section 4.2, these regions span a range of ages from ∼1 to 10 Myr. σ Ori, which was not included above because disk sizes are not available in the literature, has an inferred age of 3–5 Myr (see Ansdell et al. 2017, and references therein).
Figure 12 shows the cumulative distribution functions of disk masses in the ONC and lower-density star-forming regions. Compared to Taurus, which has a similar age, the ONC lacks massive disks and contains a larger number of low-mass disks. The disk mass distribution in the ONC also appears skewed to low masses compared with Lupus and Cham I. The ONC appears more similar to the older σ Ori region in terms of the disk mass distribution.

Figure 12. Disk dust mass cumulative distribution for the ONC compared with previous work in Taurus (Andrews et al. 2013), Lupus (Ansdell et al. 2016), Cham 1 (Pascucci et al. 2016), σ Ori (Ansdell et al. 2017), and Upper Sco (Barenfeld et al. 2016). The distributions and the 1σ confidence intervals (shaded regions) were calculated using the Kaplan–Meier estimator. In the left panel, we use only detected, dusty disks in the ONC. In the right panel, we use both detections and censored nondetections for the ONC.
Download figure:
Standard image High-resolution imageWhile one possible conclusion of the above analysis is that giant planet formation is rare in the ONC, we believe it is more likely that estimating mass using Equation (1) is inaccurate. The key assumption—optically thin dust—can easily break down in the compact disks in our sample. Furthermore, the assumption that the average dust temperature is 20 K may break down since compact disks are heated to higher average temperatures by their central stars.
To test the validity of Equation (1), we generated a small set of radiative transfer models using RADMC-3D (Dullemond et al. 2012). We adopted a baseline model12 with inner radius of 0.1 au, characteristic radius (Rc) of 25 au, disk flaring of H/R ∝ R0.15, H/R = 0.1 at 100 au, and a surface density profile, Σ ∝ R−1 up to , and falling off exponentially thereafter. For the central star, we assumed properties consistent with a pre-main-sequence M star, L* = 0.5 L⊙ and K. The dust grain sizes range from 0.05 μm to 10,000 μm with a power-law slope of −3.5. This yields an opacity at 850 μm of 3.5 cm2 g−1 (consistent with the assumed opacity used in Equation (1)). Dust mass was varied between 10−2 M⊕ and 103 M⊕.


The 850 μm fluxes predicted by these models are shown in Figure 13. For dust masses ≲0.1 M⊕, disks remain optically thin at most stellocentric radii. However, these compact disks have average dust temperatures substantially higher than the 20 K assumed above, using Equation (1). As shown in Figure 13, 40 K is more appropriate. Assuming K and using Equation (1) would reduce the dust masses (for a given submillimeter flux value) by about a factor of 2 from those listed in Table 1.


Figure 13. Synthetic 850 μm fluxes produced by radiative transfer disk models with characteristic radii of 25 au and a range of dust masses (solid curve). Masses computed from Equation (1) assuming Tdust = 20 K and Tdust = 40 K are indicated as dotted and dashed lines, respectively.
Download figure:
Standard image High-resolution imageAt higher disk masses, optical depth becomes significant, and hence the masses computed using Equation (1) are underestimated. For the brightest disks in our sample, with mJy, masses computed from Equation (1) may be underestimated by nearly an order of magnitude (Figure 13). As seen in Figure 13, with an assumed Tdust = 20 K, Equation (1) is within a factor of 2 of the radiative transfer results for most submillimeter fluxes seen in our sample.

In future work, we intend to compile broadband spectral energy distributions for our sample (including new data to be obtained), and perform radiative transfer modeling for individual detections to determine more accurate disk masses. These data will allow us to constrain many of the parameters assumed in the simple models generated above. These additional constraints will improve the fidelity of computed disk dust masses.
Even with such detailed modeling, one can only constrain the dust mass, and not the mass in larger objects like planetesimals or giant planet cores. Collisional growth timescales for planetesimals are significantly shorter than the ∼1 Myr age of the ONC (and the low-density star-forming regions discussed above), and hence we expect a large fraction of the solid mass to be sequestered in larger bodies in these systems. Comparison of inferred disk masses with exoplanetary system masses leads to the same conclusion (e.g., Najita & Kenyon 2014; Pascucci et al. 2016). Furthermore, evidence exists for the formation of giant planet cores in our solar system (Desch et al. 2017; Kruijer et al. 2017) and around other stars (e.g., ALMA Partnership et al. 2015; Dong et al. 2015; Sheehan & Eisner 2017) in less than 1 Myr.
Thus, dust masses measured in ONC disks (and disks in other star-forming regions) may not relate directly to planet formation potential. In particular, the measurements described above may underestimate the total solid inventory in disks and by extension, the total disk masses. The underestimate is, however, probably smaller than an order of magnitude. If one assumes that the conversion from submillimeter continuum flux to disk mass can be applied uniformly to the ensemble of disks in a given region (e.g., our ONC sample), then scaling up eventually leads to gravitationally unstable (and hence short-lived) disks at the high-mass end (Eisner et al. 2016; Pascucci et al. 2016).
5. Conclusions
We presented ALMA observations of the center of the ONC, covering approximately 225 cluster members. We detected submillimeter emission from 104 sources, and spatially resolved 89 of these. We removed submillimeter flux due to free–free emission in some objects, leaving only flux attributable to dust emission. Twelve objects detected in our observations are consistent with the submillimeter flux originating entirely from free–free emission. Thus, we detect dusty disks around 92 sources.
Under standard assumptions of isothermal, optically thin disks, the fluxes detected from dusty disks correspond to dust masses ranging from 0.5 to 80 Earth masses. We checked these estimates against more rigorous, radiative transfer models that include the effects of optical depth and varying dust temperature. Comparison of the simple estimates with the more rigorous models suggest errors are within about a factor of two for most objects, with the simple estimates above "true" mass values at low submillimeter fluxes and below true mass values at higher fluxes.
We measured the distribution of disk sizes and found that disks in this region are particularly compact. Most disks have Gaussian HWHM between 10 and 30 au; no disks have radii >60 au. Such compact disks are likely to be significantly optically thick, and hotter than typically assumed. The compact disk sizes largely explain the discrepancy between simple disk mass estimates and radiative transfer modeling.
Disk sizes are significantly smaller than those seen in lower-density star-forming regions. Disk masses in the ONC are also significantly lower than in low-density star-forming regions of similar age. We suggest that the disks in the ONC have been affected strongly by photoionization, and possibly stellar encounters, in this dense, high-mass star-forming region.
We argue that disks in the ONC have been truncated by external photoevaporation, due to their proximity to the massive star θ1 Ori C. We found a correlation between disk flux and projected distance from θ1 Ori C, confirming that disk properties in this region are influenced strongly by the environment. The weak correlation of measured disk flux with stellar mass, compared to steeper trends seen in lower-density star-forming regions of similar age, likely reflects the impact of strong photoionization radiation and high stellar density in the ONC.
This work was supported by NSF AAG grant 1311910. J.E. is grateful to Crystal Brogan for her extensive assistance with the data reduction. I.P. acknowledges support from NSF AAG grant 151539. This paper makes use of the following ALMA data: ADS/JAO.ALMA #2015.1.00534.S. ALMA is a partnership of ESO (representing its member states), NSF (USA) and NINS (Japan), together with NRC (Canada), MOST and ASIAA (Taiwan), and KASI (Republic of Korea), in cooperation with the Republic of Chile. The Joint ALMA Observatory is operated by ESO, AUI/NRAO, and NAOJ. The National Radio Astronomy Observatory is a facility of the National Science Foundation operated under cooperative agreement by Associated Universities, Inc. The results reported herein benefitted from collaborations and/or information exchange within NASA's Nexus for Exoplanet System Science (NExSS) research coordination network sponsored by NASA's Science Mission Directorate.
Footnotes
- 10
Most of the proplyds are also detected as near-IR objects.
- 11
In the regime of interest for this calculation, the Planck function differs from the Rayleigh–Jeans approximation by ∼50%, and hence the full Planck function must be used.
- 12
Assumed disk parameters are chosen to match those often assumed in disk modeling studies (e.g., Woitke et al. 2016).