


Abstract
The large-scale environment of the cosmic web is believed to impact galaxy evolution, but there is still no consensus regarding the mechanisms. We use a semi-analytic model (SAM) galaxy catalog to study the star formation and dust content of local galaxies in different cosmic environments of the cosmic web—namely voids, filaments, walls, and nodes. We find a strong impact of the environment only for galaxies with Mstars ≲ 1010.8M⊙: the less dense the environment, the larger the star formation rate and dust content at fixed stellar mass. This is attributed to the fact that galaxies in less dense environments typically feature younger stellar populations, a slower evolution of their stellar mass, and delayed star formation compared to galaxies in denser environments. As for galaxies with Mstars ≳ 1010.8M⊙, the differences among environments are milder, due to the disk-instability-driven supermassive black hole (SMBH) growth implemented in the SAM, which makes SMBH growth, and thus galaxy quenching, environment-insensitive. We qualitatively test our predictions against observations by identifying environments in Sloan Digital Sky Survey Data Release 16 using dust masses derived from the GAMA survey. The agreement is encouraging, particularly at , where the specific star formation rates and dust masses appear quite environment-insensitive. This result confirms the importance of in situ growth channels of SMBHs.


Original content from this work may be used under the terms of the Creative Commons Attribution 4.0 licence. Any further distribution of this work must maintain attribution to the author(s) and the title of the work, journal citation and DOI.
1. Introduction
Extensive redshift galaxy surveys, such as 2dFGRS (Colless et al. 2001), the Sloan Digital Sky Survey (SDSS; York et al. 2000), GAMA (Driver et al. 2011), eBOSS (Alam et al. 2017), and DES (Abbott et al. 2018) have revealed that galaxies define a large-scale cosmic web structure, ranging from vast low-density regions known as cosmic voids to higher-density regions, such as walls, filaments, groups, and galaxy clusters. This pattern is also present in the distribution of halos (Bond et al. 1996; Cautun et al. 2014) in cosmological simulations, e.g., EAGLE (Crain et al. 2015; Schaye et al. 2015), MultiDark (Klypin et al. 2016), and IllustrisTNG (Pillepich et al. 2018). The cosmic web results from the gravity-driven evolution of primordial density perturbations. Hence, it embodies a large amount of information that may be exploited to test different cosmological models (e.g., Bos et al. 2012; Paillas et al. 2021; Bonnaire et al. 2022). On the other hand, the properties of galaxies and their dependence on the cosmic web are crucial for understanding their formation and evolution. It is well established that a galaxy's local environment (≲5 Mpc) strongly affects its star formation activity, colors, and morphology (e.g., Dressler 1980; Balogh et al. 2004; Kauffmann et al. 2004; Bamford et al. 2009; Peng et al. 2010; Woo et al. 2013; Old et al. 2020). These works show that galaxies tend to be less star-forming, redder, and more elliptical as the local density increases. On the other hand, galaxies and their local environments are embedded in different large-scale environments (≳10–100 Mpc) of the cosmic web (like cosmic voids, walls, and filaments). However, the impacts of such environments on galaxy formation and evolution remain a matter of debate (e.g., Alfaro et al. 2022; Rodríguez-Medrano et al. 2023; Wang et al. 2023). In this work, we employ the term environment to denote the large-scale environment, unless stated otherwise.
The densest regions of the cosmic web are nodes and filaments. The most massive nodes host galaxy clusters, which represent the largest entities in the Universe that exist in a state of quasi-virial equilibrium. They feature a deep gravitational potential well permeated by an intracluster medium (ICM) of hot ionized gas. In this dense and possibly hostile environment, multiple mechanisms influence galaxy evolution. Some of them—such as ram pressure stripping, strangulation, and tidal stripping—trigger gas depletion, leading to the quenching of star formation (see, e.g., Abadi et al. 1999; Gnedin 2003; Peng et al. 2015; Vijayaraghavan & Ricker 2015; Steinhauser et al. 2016). Due to these processes and frequent interactions, clusters of galaxies host galaxies often characterized by red colors and elliptical morphologies (e.g., Dressler 1980; Whitmore et al. 1993; Domínguez et al. 2001; Bamford et al. 2009; Paulino-Afonso et al. 2019).
Nodes are connected by filaments, elongated structures that have undergone gravitational collapse along two principal axes. They represent a kind of bridge along which matter flows to accrete into nodes. Filaments are the predominant visual features within the cosmic web and host galaxies that tend to exhibit larger mass, a redder color, and earlier-type morphologies compared to their counterparts in less dense environments (Chen et al. 2017; Kuutma et al. 2017; Kraljic et al. 2018; Laigle et al. 2018).
In contrast to high-density regions, large voids represent the extremely low-density environment characterized by reduced galaxy mergers and interactions compared to the field or groups. Cosmic voids represent unique and pristine environments where galaxies are unaffected by the transformation processes typical of overdense galaxy systems, like clusters and groups. Thus, they allow the study of galaxy evolution as a result of nature only, without nurture.
Numerous studies have focused on galaxies in cosmic voids and found that they appear to have significantly different properties than field galaxies. The luminosity function of galaxies in voids (e.g., Hoyle et al. 2005) shows a fainter characteristic magnitude. However, the relative importance of faint galaxies is similar to that found in the field. Spectroscopic and photometric properties of void galaxies have also been studied in detail (Hoyle et al. 2005, 2012; Rojas et al. 2005; Kreckel et al. 2012). These results indicate that galaxies inside voids have higher star formation rates (SFRs) and bluer colors than galaxies in denser regions and continue to form stars today at similar rates to those in the past. Statistical studies using observational data report that void galaxies are smaller, bluer, of later-type morphology, and more star-forming than those in average density environments (Grogin & Geller 2000; Rojas et al. 2004; Hoyle et al. 2005; Patiri et al. 2006; Park et al. 2007; Wegner & Grogin 2008; Kreckel et al. 2011; Liu et al. 2015; Tavasoli et al. 2015; Moorman et al. 2016; Beygu et al. 2017; Ceccarelli et al. 2021; Jian et al. 2022). Finally, we mention the relevant result recently presented by Domínguez-Gómez et al. (2023) within the context of the CAVITY project. The authors of this latter work performed a spectral analysis on a sample of nearby galaxies in voids, filaments and walls, and clusters. They found a clear correlation between the density of the large-scale environment and the star formation history (SFH)—namely galaxies in less dense environments feature a slower SFH; that is, void galaxies assemble their stellar mass slower.
On the theoretical side, both hydrodynamic simulations and semi-analytic models (SAMs) have been used to shed light on the influence of the large-scale environment on galaxy evolution. Kreckel et al. (2011) identified higher SFRs and younger stellar ages in void galaxies through their hydrodynamic simulation. Rieder et al. (2013) studied the formation of (sub)structures in the halo distribution in voids, within the context of the Cosmogrid simulation. Habouzit et al. (2020) employed the Horizon-AGN simulation (Dubois et al. 2014), coupled to the VIDE void finder (Sutter et al. 2015), in order to investigate the black hole population within cosmic voids. They reported no significant variations in the black hole growth in voids compared to more dense environments. Rosas-Guevara et al. (2022) studied central galaxies located within and near voids using the EAGLE simulation (Crain et al. 2015; Schaye et al. 2015) and the spherical voids catalog by Paillas et al. (2017). They analyzed in detail the star formation, metallicity, morphology, and assembly history of galaxies as a function of their stellar mass and environment. Alfaro et al. (2020, 2021) studied the halo occupation distribution (HOD) in cosmic voids and future virialized structures (FVSs). Making use of the semi-analytic catalog MDPL2-SAG (Cora et al. 2018; Knebe et al. 2018) and the hydrodynamic simulation TNG300 (Pillepich et al. 2018), they found a lower (higher) than average HOD and formation redshift in voids (FVSs). Finally, Jaber et al. (2023) exploited the SAGE SAM (Croton et al. 2016) and the SpineWeb algorithm (Aragón-Calvo et al. 2010) to study the large-scale dependence of the metallicity and stellar-to-halo mass ratio. Their results indicate the presence of a threshold mass (respectively, Mhalo ≃ 1012 M⊙ h–1 and Mstars ≃ 1010 M⊙ h–1) below which the stellar-to-halo ratio and metallicity are enhanced in dense environments.
Despite the substantial achievements of these studies, we still need a complete understanding of how galaxy properties correlate with the large-scale environment. The distinct underlying physical models within different simulations and the lack of a single, clear-cut definition for large-scale environments hinder a direct comparison of results. Furthermore, such complexities make it challenging to establish the relative impacts of different physical mechanisms on galaxy evolution in distinct environments.
In this work, we study the dependence on the large-scale environment of star formation and, for the first time, the dust content of local galaxies. We use a galaxy catalog obtained from a SAM, and different methods are adopted to identify cosmic environments, namely voids, walls, filaments, and nodes. The primary advantage of our approach lies in the computational efficiency of the SAM method, enabling us to simulate relatively large volumes. This capability is essential for obtaining a reliable statistical representation of large-scale cosmic environments. Furthermore, the simplicity of running the SAM, and the subsequent ability to test various physical models, makes identifying the roles of different physical processes in shaping the environmental dependence of galaxy properties easier. Also, adopting multiple methods to define environments enhances the reliability of our results and mitigates the inherent arbitrariness in defining large-scale structures.
In order to check our results, we compare them with observations. We use SDSS Data Release 16 (DR16) for environmental classification, stellar mass, and SFRs. At the same time, for a subset of galaxies, we utilize dust mass measurements from the GAMA and H-ATLAS surveys. Our qualitative comparison yields highly encouraging results, highlighting the significance of the in situ supermassive black hole (SMBH) growth mechanism, specifically secular accretion during disk instabilities (DIs), in our case. In a broader context, our work underscores the importance of investigating galaxy evolution in diverse environments as a possible way of assessing the relative significance of in situ and ex situ processes.
The paper is organized as follows. The adopted SAM and the observational data are briefly described, respectively, in Sections 2 and 3. In Section 4, we describe the process of environment classification in both the simulated and observed samples. The star formation and dust content of simulated galaxies in different large-scale environments, as well as their evolution, are investigated in Sections 5.1 and 5.2, while Section 5.3 focuses on the impact of the DI-driven SMBH growth. In Section 6, we compare the SAM results with observations, and finally we draw our conclusions, after summarizing the work, in Section 7.
2. The SAM
SAMs are valuable tools for studying galaxy evolution, owing to their exceptional capability to simulate extensive volumes while providing a comprehensive—albeit simplified—representation of the numerous physical processes that shape the properties of galaxies (e.g., White & Frenk 1991; Cole et al. 2000). SAMs provide simplified descriptions of the baryonic processes shaping galaxy populations within dark matter (DM) halo merger trees. These processes include gas inflow, cooling, star formation, SMBH growth, and feedback effects. The assumed sequence begins with gas collapse, forming rotation-supported gas disks with mild star formation. Spheroidal galaxies result from mergers and instabilities, potentially leading to starbursts. Also, environmental effects, e.g., ram pressure and tidal forces, are often considered. These baryonic processes are modeled through approximate and motivated relationships to evolve the galaxy population over time.
In this work we adopt the last public release 9 of the Munich galaxy formation model, L-Galaxies (Henriques et al. 2020), along with the updates introduced and discussed in Parente et al. (2023, hereafter P23). In the latter work, we implemented a detailed treatment of the dust grain formation and evolution, as well as an updated treatment of DIs. The dust model (Section 2.1 of P23) includes two sizes (large and small grains, with radii 0.05 and 0.005 μm) and two chemical compositions (silicate and carbonaceous, MgFeSiO4 and C) of grains. Briefly, grains are produced in AGB star envelopes and Type II supernova (SN) ejecta, thus they are ejected into the surrounding gaseous medium. Here, the model takes into account different processes that affect the mass (grain accretion, destruction in SNe shocks, and thermal sputtering) and the size (shattering and coagulation) evolution of grains. These processes depend on the physical properties of the galaxy as provided by the SAM (e.g., molecular gas fraction, gas temperature, and metallicity). As for the new treatment of DIs (Section 2.2 of P23), we now consider the instability of the combined gas+stars disk (only the stellar disk was considered in Henriques et al. 2020). The disk becomes unstable when the centrifugal force cannot counteract its self-gravity. The instability is particularly relevant for building up the spheroidal component of low-to-intermediate mass () galaxies. In these episodes, the unstable stellar component is transferred into the bulge, while the unstable gas can both fuel a starburst and accrete onto the central SMBH. The fraction falling into the SMBH is fBH,DI, which is a decreasing function of the virial velocity of the halo, according to a popular phenomenological description used in SAMs (Kauffmann & Haehnelt 2000; see also Equation (23) of P23). The chosen values of the free parameters in this relationship ensure that the model predictions align with the observed relative fraction of massive star-forming and quiescent galaxies (Appendix B of P23). For reference, fBH,DI is of the order of 10−4–10−5.

The aforementioned modifications allow our SAM to reproduce a broad range of galaxy properties concerning dust—in particular, the cosmic evolution of the galactic dust abundance and the local fraction of elliptical galaxies—while still reproducing several crucial properties of the galaxy population (e.g., cosmic star formation and mass functions). Among the modifications introduced, the SMBH growth during DIs is particularly relevant, since it actively operates to reduce star formation in the most massive objects due to the radio-mode active galactic nucleus (AGN) feedback, and it turns out to be very relevant for the results presented here (see the extended discussion in Section 5.3). For this reason, along with the standard fiducial (FID) version of P23, in the following we will often discuss results obtained by switching off the SMBH growth channel during DIs (fBH,DI = 0). 10
Finally, regarding environmental processes, the adopted version of L-Galaxies models tidal stripping, ram pressure stripping, and tidal disruption, all processes that shape the properties of satellite galaxies. A detailed overview of these processes is available in the supplementary material of Henriques et al. (2020; but see also Ayromlou et al. 2021 for an improved treatment of environmental processes within the L-Galaxies framework).
The SAM is run on top of the Millennium merger trees (Springel et al. 2005; box size 500 Mpc/h, 21603 particles), and a Planck cosmology 11 (Planck Collaboration et al. 2014) is assumed throughout this work (h = 0.673, Ωm = 0.315, Ωb = 0.0487, and σ8 = 0.829). A Chabrier (2003) initial mass function is adopted. We analyze galaxies with a stellar mass content of at least , which approximately corresponds to the resolution limit of the underlying DM simulation (e.g., Guo et al. 2011).

3. Observational Data
We exploit different data sets to test our model predictions concerning the star formation and dust content of galaxies in different environments. We use SDSS DR16 (Ahumada et al. 2020) to identify cosmic environments. We use galaxies with r-band apparent magnitudes r < 17.77 (completeness limit) and in the redshift range 0.02 < z < 0.1. We take stellar masses and SFRs from the MPA-JHU catalog (Kauffmann et al. 2003).
As for the dust masses, we exploit the results presented in Beeston et al. (2018), who studied the local (z < 0.1) dust mass function for galaxies in the GAMA/H-ATLAS surveys. Specifically, the physical properties of these galaxies (including dust mass) were obtained by Driver et al. (2018) using a spectral energy distribution fitting procedure.
4. Environmental Classification
We employ various methods to identify cosmic environments within the simulated and observed large-scale structures. We categorize environments in two fundamental ways. One involves employing a single and homogeneous method, NEXUS+, to segment the cosmic web into voids, walls, filaments, and nodes. The other approach, which will often be dubbed R19+T23+FOF, utilizes multiple independent methods for identifying specific environments (voids and walls, filaments, and groups). The former is exclusively applied to the simulation, while the latter is employed in both the observed and simulated galaxy catalogs. It is important to stress that no tuning of their parameters has been made to match the environments extracted from NEXUS+ with those extracted using the R19+T23+FOF approach. As can be appreciated in Figure 1, there are various differences between these two approaches, the most important one being the number of galaxies detected as belonging to a given environment. While NEXUS+ associates every galaxy in our simulation with a given environment, this is not true for the R19+T23+FOF method. However, although there is a discrete visual match between the environments detected by the two approaches, we stress the objective of our study is not to compare the performance of different identification algorithms. Instead, our focus is on examining the consistency and reliability of our results concerning the influence of the environment on galaxy properties, regardless of the method used to identify the different environments.

Figure 1. A 25 Mpc h–1 slice of our simulation box showing the outcome of the environment identification processes. Each point represents a DM halo and is color-coded according to the assigned environment. The left panel shows the results obtained by NEXUS+, which categorizes each DM halo of the simulation as belonging to a void, wall, filament, or node. In the right panel, we show the combination of the specific identifiers for distinct environments (R19+T23+FOF), i.e., spherical voids and their walls, cylindrical filaments, and massive groups (Mgroup > 1013.5 M⊙). It is important to note that while NEXUS+ assigns every DM halo to an environment, this is not necessarily the case for the R19+T23+FOF approach, where a galaxy might not be classified as belonging to any specific environment.
Download figure:
Standard image High-resolution imageIn the following sections, we introduce each specific environment we focus on and provide a comprehensive overview of each identification method adopted.
4.1. Cosmic Web Segmentation: NEXUS+
For the segmentation of the simulated cosmic web into its distinct structural environments, we use the Multiscale Morphology Filter (MMF)/NEXUS pipeline, specifically its NEXUS+ version (Cautun et al. 2013, 2014). This is the highest-dynamic-range version of the library of routines for pattern classification based on the MMF/NEXUS formalism (Aragón-Calvo et al. 2007, 2010; Cautun et al. 2013, 2014; Aragon-Calvo et al. 2014; and see also Libeskind et al. 2018 for a short review). This formalism represents a scale-adaptive framework that classifies the matter distribution on the basis of local spatial variations in the density field, velocity field, or gravity field. Subsequently, a set of morphological filters is used to classify the spatial matter distribution into three basic components: the clusters, filaments, and walls that constitute the cosmic web. The remaining volume elements are classified as parts of voids. The end product of the pipeline is a map where for each location in the analyzed volume the morphological identity is specified.
In practice, NEXUS+ takes as input a regularly sampled density field, which we obtain by projecting the halo distribution onto a regular grid using the cloud-in-cell interpolation scheme. In a first step, the input field is Gaussian smoothed using a log-density filter that is applied over a set of scales from 1 to 11h−1Mpc. It results in a map of 10243 cells, corresponding to a cell size of 0.472h−1Mpc. Then, for each smoothing scale, the resulting density is used to calculate the Hessian matrix and its corresponding eigenvalues, whose values and signs determine the environmental response at each location, i.e., grid cell. In the last step, NEXUS+ combines the environmental signatures of all the scales to obtain a scale-independent value. In this work, roughly 79.3% of the total volume of the box corresponds to cells located in voids, 14.5% is classified as belonging to walls, 6.0% as located in filaments, with a mere 0.2% corresponding to nodes. Assigning to each halo the environment of its hosting cell, we find that of the total DM mass within the box, 9.5% resides in voids, 16.9% in walls, 34.5% in filaments, and 39.1% in the cluster nodes of the cosmic web.
4.2. Spherical Void Identification
We use the spherical void finder algorithm presented in Ruiz et al. (2015, 2019) as an alternative method for constructing our voids catalog. This method aims at identifying the largest nonoverlapping spherical regions that satisfy the number density of tracers inside them being less than 10% of the mean:

where Δ(r) is the integrated density contrast at scale r and rvoid is the void radius.
We use the DM halos as structure tracers when applying this algorithm to our SAM galaxies. We adopt Mhalo ≥ 1012 h−1 M⊙ as the halo mass cut, obtaining 2729 voids. After constructing the voids catalog, we define void galaxies as those residing within r/rvoid ≤ 1 and void wall galaxies as those located immediately outside the voids with 1 < r/rvoid ≤ 1.2. These void galaxies are predominantly found in NEXUS+ voids (∼64%), while galaxies in the void shells are more homogeneously distributed among NEXUS+ voids, walls, and filaments (respectively, ∼31%, 34%, and 32%).
The same algorithm is adopted to identify voids on top of the observational catalog. Details of the algorithm's application to observational samples are provided in Ruiz et al. (2019). Specifically, in this work, the void identification is the same as in Rodríguez-Medrano et al. (2023; see their Section 2.1). Voids are identified in a volume-complete sample with limiting redshift z = 0.1 and maximum absolute magnitude in the r band, , extracted from the main SDSS region. In our analysis, we have discarded voids close to the edge of the catalog—namely void centers at distances smaller than 1.8rvoid. Starting from this voids catalog, we then define voids (r/rvoid ≤ 1) and void wall galaxies (1 < r/rvoid ≤ 1.2).

4.3. Filament and Group Identification
As for the more dense environments, we also identify galaxy groups and filaments with an alternative approach. Galaxy groups are identified with friends-of-friends (FOF) halos in our SAM catalog. As for observed galaxies, we utilize the group catalog presented by Rodriguez et al. (2022), which is derived from SDSS DR16 using the algorithm introduced in Rodriguez & Merchán (2020). This method initially applies the FOF algorithm to identify galaxy systems that are gravitationally bound and have at least one bright galaxy with an r-band absolute magnitude brighter than −19.5. Subsequently, a halo-based algorithm (Yang et al. 2005, 2007) is applied. A three-dimensional density contrast is calculated in redshift space using a characteristic luminosity calculated with the potential FOF galaxy members. The estimation procedure considers the incompleteness caused by the observational catalog's limiting magnitude. Next, by abundance matching on luminosity, the mass of each group is assigned. Assuming that galaxies populate the DM halos following a Navarro et al. (1997) profile and using the assigned mass, the three-dimensional density contrast is calculated to associate galaxies with the groups. With this last assignment of members, the procedure recalculates the characteristic luminosity and iterates until it converges. This algorithm showed excellent results in purity and completeness (Rodriguez & Merchán 2020).
Once the galaxy groups have been identified, they are used to build a catalog of filaments in the large-scale structure. They are cylinders linking groups of galaxies. Our approach is similar to the filament identification carried out by Taverna et al. (2023), which, in turn, is based on the original algorithm by Martínez et al. (2016). Starting from the group sample, we search for all pairs of groups more massive than a selected mass cutoff Mmin that are separated (in redshift space, in the case of the observations) by a comoving distance smaller than a given threshold . For each pair of groups thus selected, we compute the numerical overdensity of galaxies in a cylinder of radius R that extends between the two groups. The overdensity in this volume is obtained by the ratio between the number of galaxies that lie in the cylinder and the number of points within the same cylinder from an unclustered homogeneous distribution of points. This homogeneous distribution of points mimics the selection function of galaxies, while being 100 times denser, in order to reduce the shot noise in the overdensity computation. We require the numerical overdensity of galaxies in the cylinder to be greater than unity in order to consider a pair of groups to be linked by a filament. The galaxies in these cylindrical regions are considered to be galaxies in filaments.

In this work, we use , Mpc, which is the correlation length of groups more massive than Mmin, according to Zandivarez et al. (2003), and R = 2.2 Mpc (see Taverna et al. 2023). Galaxies identified in cylindrical filaments belong mainly to NEXUS+ filaments (∼55%), walls (∼25%), and nodes (∼19%), while galaxies in massive groups almost uniquely belong to NEXUS+ nodes (∼95%). For the SDSS DR16 groups and galaxies, our unclustered homogeneous distribution of points mimics the selection function of SDSS DR16 galaxies regarding angular coverage and redshift distribution.


5. Properties of Galaxies across Cosmic Environments
This section examines various physical properties of our simulated galaxies in different environments. Namely, we look at the star formation and dust content. The environmental dependence of dusty properties—such as the dust-to-gas (DTG) ratio and the size and chemical composition of dust grains—is discussed in Appendix B.
In the following analysis, we show the results for the NEXUS+ environments (voids, walls, filaments, and nodes), as well as for the other environmental definitions adopted in this work, namely spherical voids and their associated walls, cylindrical filaments, and massive groups (Mgroup > 1013.5 M⊙). A visual representation of the environmental identification in our simulated box can be appreciated in Figure 1 for both the aforementioned methods, and we report the number of objects identified in each environment in Table 1.
Table 1. Number of Galaxies in Our Simulated Catalog Categorized According to Environmental Classifications via the Two Approaches Employed in This Work, Namely NEXUS+ and R19+T23+FOF (Section 4)
| Number of Objects [105] | ||
|---|---|---|
| NEXUS+ | R19+T23+FOF | |
| Voids | 33.6 | 9.3 |
| Walls | 38.4 | 19.0 |
| Filaments | 49.9 | 8.6 |
| Nodes/massive groups | 30.1 | 11.0 |
Download table as: ASCIITypeset image
5.1. Star Formation and Dust
The environment selection introduces a mass bias—namely more massive galaxies are associated with more clustered environments (Appendix A). To avoid this issue, we could study the properties of galaxies with identical stellar mass distributions in different environments. The procedure of selecting samples with the same mass distribution as in voids certainly removes the mass bias; however, since void galaxies are typically less massive than the whole population, this analysis may not be representative of the full range of Mstars. For this reason, in this section we analyze galaxy properties in different environments at fixed stellar mass.
We show in Figure 2 the specific SFR (sSFR) and dust mass as a function of stellar mass. In the range , we observe a clear trend with the environment, regardless of the environmental definitions adopted. Namely, at fixed stellar mass, the less dense the environment is, the more star-forming and dust-rich are the galaxies. Above this stellar mass value, we observe no clear trend with the environment for the sSFR. As for the dust mass, differences among environments are strongly reduced. This result suggests that the environmental dependence of dust and star formation properties is suppressed in galaxies above the stellar mass threshold. We will discuss this point at length in the following.


Figure 2. sSFR (left panel) and dust mass (right panel) as a function of stellar mass for simulated galaxies in different environments. We report the results for NEXUS+ environments (voids, walls, filaments, and nodes; top panels), as well as for the other environmental definitions adopted in this work—namely spherical voids and their walls, cylindrical filaments, and massive groups (R19+T23+FOF; bottom panels). Solid lines represent median trends, with the typical 16th–84th percentile dispersion shown as a gray shaded area.
Download figure:
Standard image High-resolution imageWe note that our finding of higher star formation in voids is in keeping with some observational results that have pointed out that void galaxies are typically more star-forming and gas-rich than nonvoid ones (e.g., Rojas et al. 2005; von Benda-Beckmann & Müller 2008; Kreckel et al. 2014; Beygu et al. 2016; Moorman et al. 2016; Florez et al. 2021). The same has also been found in numerical simulations (e.g., Cen 2011; but see also Rosas-Guevara et al. 2022, who found different environmental trends in different stellar mass regimes). Our findings are also consistent with Martínez et al. (2016), particularly in relation to the sSFR of filament galaxies. These rates are intermediate, falling between those observed in groups and those in less dense environments. They additionally indicate that variations among environments are less pronounced when considering high-mass galaxies.
5.2. Galaxy Evolution across Environments
The scenario depicted above may be understood if galaxies undergo a slower evolutionary process in less dense environments. This idea is corroborated by the mass-weighted age of stellar populations, displayed in Figure 3, which suggests the existence of a relationship between age and environment for Mstars ≲ 1010.8 M⊙. Void galaxies are the youngest and node (or massive group) galaxies exhibit the oldest ages. Wall and filament galaxies fall in between, with filament galaxies systematically displaying older ages compared to wall galaxies. We devote this section to further investigation of this point. In particular, we aim to understand the differences in the evolution of galaxies with equal stellar mass at z = 0 that reside in different environments.

Figure 3. Mass-weighted stellar population age as a function of stellar mass for simulated galaxies in different environments, as detailed in Figure 2.
Download figure:
Standard image High-resolution imageWe thus inspect the stellar mass, 12 SFR, and dust mass evolution for galaxies with in Figure 4. The figures indicate that the denser the environment is, the faster the evolution for is, in the sense that the SFR peaks at earlier epochs, and consequently the evolution of the stellar mass is more rapid. This holds true irrespective of the chosen environmental definition. As for the dust mass evolution, it reaches a maximum more recently than the SFR, suggesting that the time of the maximum dust content of a galaxy does not correspond to the time of the maximum of its star formation activity. We argue that this is due to the fact that the dust budget is determined not only by the production of dust by stars, but also by its evolution, and by grain accretion in particular. 13 We also note that the peak of the dust abundance occurs later in lower-density environments and in lower- objects. This maximum has yet to be reached in void and wall galaxies of the less massive bin. This is consistent with the slower evolution of galaxies in lower-density environments.


Figure 4. Stellar mass (top panels), SFR (middle panels), and dust mass (bottom panels) evolution for galaxies with different values of present-day stellar mass, namely (from left to right) . For each quantity, we report the results for galaxies residing at z = 0 in different NEXUS+ environments (voids, walls, filaments, and nodes), as well as for the other environmental definitions adopted in this work, namely spherical voids and their walls, cylindrical filaments, and massive groups (R19+T23+FOF). The colors are as in previous figures. For each environment, we randomly selected ∼103 objects with in a narrow range (0.1 dex) around the reported value, and traced their evolutionary paths along the merger tree back in time. Solid lines represent median trends, with the 16th−84th percentile dispersion shown as a shaded area.


Download figure:
Standard image High-resolution imageThe slower stellar assembly in less dense environments has already been pointed out by other works based on hydrodynamical simulations (Artale et al. 2018; Alfaro et al. 2020; Habouzit et al. 2020; Rosas-Guevara et al. 2022) and recently confirmed through observations by Domínguez-Gómez et al. (2023).
As for the most massive stellar bin under examination, galaxies with show no notable distinctions across diverse environments. The lack of difference in the evolution of these high-mass galaxies aligns with the findings discussed in Section 5.1, which suggest the existence of a certain stellar mass threshold (≃1010.8 M⊙) above which the influence of the large-scale environments becomes less relevant.

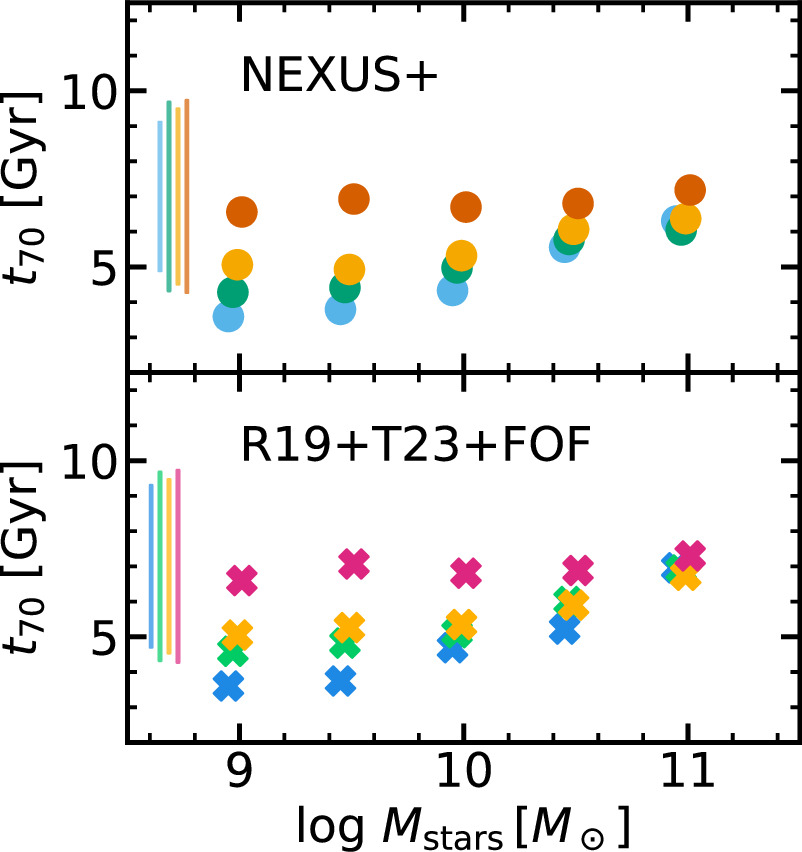
The same conclusions may be drawn from an analysis of t70, the lookback time at which the stellar mass of a given galaxy is 70% of its present-day value. In Figure 5, t70 is shown as a function of stellar mass and for different environments. First, we note that for galaxies with , t70 tends to increase with stellar mass for voids, walls, filaments, and, more weakly, nodes and massive groups. The last is due to the significant impact of old satellite galaxies mainly dominating the population of these dense environments at . Second, we observe that for , at a fixed stellar mass, the time of assembly for the stellar mass is delayed in less dense environments. This delay is reflected in t70, which is typically smaller for galaxies in less dense environments. Above the mentioned mass, there is no clear dependence on environment, as already pointed out.


Figure 5. Assembly time of the stellar mass for galaxies in different environments and different z = 0 stellar mass bins. The time is expressed as t70, the lookback time when the galaxy reached 70% of the present stellar mass. The crosses and circles refer to median values, while the typical 16th−84th percentile dispersion is reported as the lines on the left side of each panel. The colors and environments are as in Figure 2.
Download figure:
Standard image High-resolution imageNotably, the observational study by Domínguez-Gómez et al. (2023) also revealed minimal changes in the assembly time of high-mass galaxies (log Mstars/M⊙ ≃ 10.5–11) across various environments, contrasting with galaxies of smaller masses (9 < Mstars/M⊙ ≲ 10.5–11; refer to their Figures 4(a) and (d)). They hypothesized that the evolution of these high-mass galaxies might be more influenced by local interactions or their massive DM halos than by large-scale environments. In our model, we anticipate that, regardless of galaxy interactions, the in situ growth of SMBHs in galaxies is crucial for understanding this behavior. Likewise, Domínguez-Gómez et al. (2023) observed similar assembly times for galaxies in their lowest stellar mass bin (log Mstars/M⊙ < 9), suggesting a strong impact of the small-scale environment on objects of these masses, which are predominantly satellites. Since our analysis is limited to galaxies with log Mstars/M⊙ ≥ 9, we cannot determine if this behavior is also present in our model.
5.3. The Impact of in Situ SMBH Growth on Isolated Galaxy Evolution
The latter result is quite interesting. It suggests that the environmental dependence of galaxy evolution is important up to some characteristic mass (log Mstars/M⊙ ≃ 10.8 in our model). Above this threshold, galaxies in different large-scale environments with the same stellar mass feature very similar properties.
This outcome is due to the treatment of SMBH growth and feedback, the main channel of massive galaxy quenching in our SAM. In more detail, in our model, SMBHs can grow during mergers, by hot gas accretion, and during DIs. In massive galaxies, the contribution of the latter process 14 is typically less relevant than mergers in terms of mass. However, this channel is crucial in isolated systems, where (in the absence of mergers) it is the only available channel for starting the SMBH growth that will eventually quench the galaxy. Thus, it has a profound impact on the results discussed in this work.
We demonstrate this by comparing the results obtained by our FID SAM and a version in which the SMBH growth in DIs is switched off (fBH,DI = 0). In particular, Figure 6 displays the number of mergers experienced up to z = 0 and the fraction of stellar mass assembled ex situ (i.e., in mergers) for galaxies in distinct environments for both models. In the fBH,DI = 0 model, there are evident differences across environments for —namely, the denser the environment, the larger the number of mergers experienced at z = 0 and, consequently, the larger the fraction of stellar mass assembled ex situ. However, these differences are not present in the FID model. At first glance, this is quite surprising, since we would expect the number of mergers to be independent of the baryonic physics implemented within the model, as it is determined by the adopted DM halo merger tree. 15


Figure 6. Mean number of mergers (left panel) and ex situ fraction of the total stellar mass (right panel) as a function of stellar mass for the simulated galaxies. We report the results for galaxies residing at z = 0 in different NEXUS+ environments (voids, walls, filaments, and nodes; top panels), as well as for the other environmental definitions adopted in this work, namely spherical voids and their walls, cylindrical filaments, and massive groups (R19+T23+FOF; bottom panels). Results from both the FID (solid) and fBH,DI = 0 (dotted) SAM are shown.
Download figure:
Standard image High-resolution imageThe reason why our novel 16 in situ SMBH growth channel produces such differences may be understood via the following picture. The DI-driven SMBH growth enhances the quenching of the most massive objects (P23), thus only galaxies that can accumulate a significant mass fraction through mergers are capable of reaching large stellar masses (), since the in situ star formation is suppressed by the instability-driven SMBH growth. This effect is particularly pronounced in galaxies located in less dense environments, which generally undergo fewer merger events. This is also the reason why the fraction of stellar mass formed through mergers, i.e., acquired ex situ, is influenced by our DI model (Figure 6).

In other words, according to our FID SAM, only galaxies that acquire a substantial stellar mass from mergers can reach large Mstars ( ≳ 1010.8 M⊙).
Concluding this section, it is worth remarking that our DI model significantly modifies the in situ evolution of galaxies, 17 particularly impacting the environmental dependence of certain properties. This is not surprising, considering mergers' prominent role in shaping galaxy evolution within SAM frameworks. Consequently, we speculate that a thorough (also observational) study of galaxy properties in different cosmic environments could serve as an effective test bench for assessing the relative significance of the in situ and ex situ processes implemented within SAMs. We perform a step in this direction in Section 6, where we compare the sSFR and dust content for the FID and fBH,DI = 0 models across different large-scale environments with observations.
Finally, it is noteworthy that Jaber et al. (2023), using the SAGE SAM, observed a significant increase in metallicity for galaxies located in the densest environments compared to the entire sample. However, similar to our findings, the influence of the environment disappears for galaxies with stellar masses exceeding ≃1010 M⊙ h–1. It is notable that their model also utilizes unstable cold gas to fuel the growth of central black holes, although they do not attribute the observed result to this mechanism.
5.4. Convergence Mass and SMBH Growth
Based on the previous discussion, it becomes clear that there is a stellar mass threshold beyond which no noticeable distinctions exist among galaxies in various environments, given a constant stellar mass. In our reference model, this convergence mass may exhibit slight variations, depending on the property under consideration and the method used to identify the different environments. However, it is approximately Mconv ≃ 1010.8 M⊙ for both the sSFR and dust mass (Figure 2). In Section 5.3, we have shown that this behavior is due to the DI-driven SMBH growth channel. This process is regulated by the parameter fBH,DI, representing the fraction of unstable gas that undergoes accretion onto the BH during episodes of DIs (fBH,unst in Equation (23) of P23). Here, we assess the stability of the convergence mass to changes in fBH,DI when using different environmental identifiers: NEXUS+, on one hand, or specific identifiers for distinct environments—spherical voids, cylindrical filaments, and massive halos—on the other hand (R19+T23+FOF).
To this end, we operationally define the convergence mass as follows. We calculate the median trends of the Mstars–sSFR relation 18 for all the environments, as reported in Figure 2. We employ stellar mass bins of 0.1 dex. The convergence mass Mconv is identified as the smallest Mstars value where the median sSFR for all environments falls within a range of 0.2 dex. We compute Mconv for different runs in which we modify only the fBH,DI parameter by a constant factor, 19 specifically fBH,DI times 0.2, 0.5, 2, 5, and 10. The results for the convergence mass obtained in these experiments are reported in Figure 7.

Figure 7. Convergence mass for different runs where the parameter ruling the DI-driven SMBH growth (fBH,DI) is modified by a constant factor, specifically fBH,DI times 0.2, 0.5, 2, 5, and 10. The convergence mass is the stellar mass above which the Mstars–sSFR relation shows no discernible difference among galaxies belonging to different environments, at fixed stellar mass. We report the results obtained with NEXUS+ environments (purple crosses) as well as for the other environmental definitions adopted in this work, namely spherical voids and their walls, cylindrical filaments, and massive FOF groups (green circles; R19+T23+FOF).
Download figure:
Standard image High-resolution imageThe general trend suggests that regardless of the environment classification process, the convergence mass decreases as the efficiency of the DI-driven SMBH growth increases. This is because higher values of fBH,DI lead to more efficient and rapid SMBH growth, enabling these objects and their associated feedback to be relevant in less massive systems. A departure of a factor of 2 from the FID times 1 value implies a variation of approximately 0.2 dex in Mconv.
It is important to note that the parameters defining fBH,DI allow our model to reproduce the local stellar mass function (SMF) and the fractions of quenched galaxies at different masses (Section 3.1 of P23) and were not further adjusted in the present work. Interestingly, as will be seen in Section 6, the convergence mass also manifests in observed galaxy samples. However, we prefer to use the results in this section as an experiment for improving the understanding of our model's physics, rather than using it for direct model refinement.
6. Comparison with Observations
In this section, we compare observations with our SAM predictions. As for our simulated galaxies, in order to highlight the importance of the in situ, DI-driven, SMBH growth channel, we compare the predictions obtained from our FID version of the SAM with the aforementioned scenario where SMBH accretion during DIs is switched off (fBH,DI = 0).
Our goal is to compare the environments identified in the simulated and observed samples as fairly as possible, exploiting the identification methods detailed in Section 4. Specifically, here we focus on four different environments, ranging from low to high large-scale density.
- 1.
- 2.Walls—this category includes galaxies in the proximity (1 < r/rvoid ≤ 1.2) of the aforementioned spherical voids.
- 3.
- 4.Massive groups—these are galaxies belonging to groups more massive than Mgroup > 1013.5 M⊙. In the observational catalog, the group mass is estimated by the Rodriguez & Merchán (2020) algorithm, while in our SAM, we take the virial mass of the FOF halo (Section 4.3). We take these galaxies as representative of the densest regions of the large-scale structure.
The criteria employed and the number of objects identified in each environment within the observed galaxies catalog are summarized in Table 2.
Table 2. Details of the Environmental Identification Performed on the SDSS DR16 Catalog (See Section 4)
| Number of Galaxies | ||||
|---|---|---|---|---|
| Environment | Algorithm | Criterion | SDSS | GAMA/H-ATLAS |
| Catalog | Sample | |||
| Voids | Ruiz et al. (2015, 2019) | r/rvoid ≤ 1 | 9367 | 95 |
| Walls | Ruiz et al. (2015, 2019) | 1 < r/rvoid ≤ 1.2 | 16,863 | 138 |
| Filaments | Taverna et al. (2023) | Mnodes ≥ 1013.5 M⊙ | 12,556 | 395 |
| Massive groups | Rodriguez & Merchán (2020) | Mgroups ≥ 1013.5 M⊙ | 35,161 | 380 |
Note. For each environment (voids, walls, filaments, and massive groups), we report the identification method adopted and the number of galaxies identified in the SDSS catalog and GAMA/H-ATLAS sample. Note that the number of galaxies in our simulated sample is much larger (Table 1).
Download table as: ASCIITypeset image
We emphasize that our purpose is not to conduct a one-to-one comparison between environments in observations and simulations. Instead, our main interest is comparing trends among the environments of the two samples.
6.1. Star Formation
In Figure 8, we show the sSFR distributions for galaxies in different stellar mass bins and cosmic web environments. As widely discussed in the literature (e.g., Katsianis et al. 2021), this distribution typically features a bimodal behavior, which corresponds to the superposition of a star-forming (sSFR ≃ 10−10 yr−1) and a passive population (sSFR ≃ 10−12 yr−1) at z = 0.
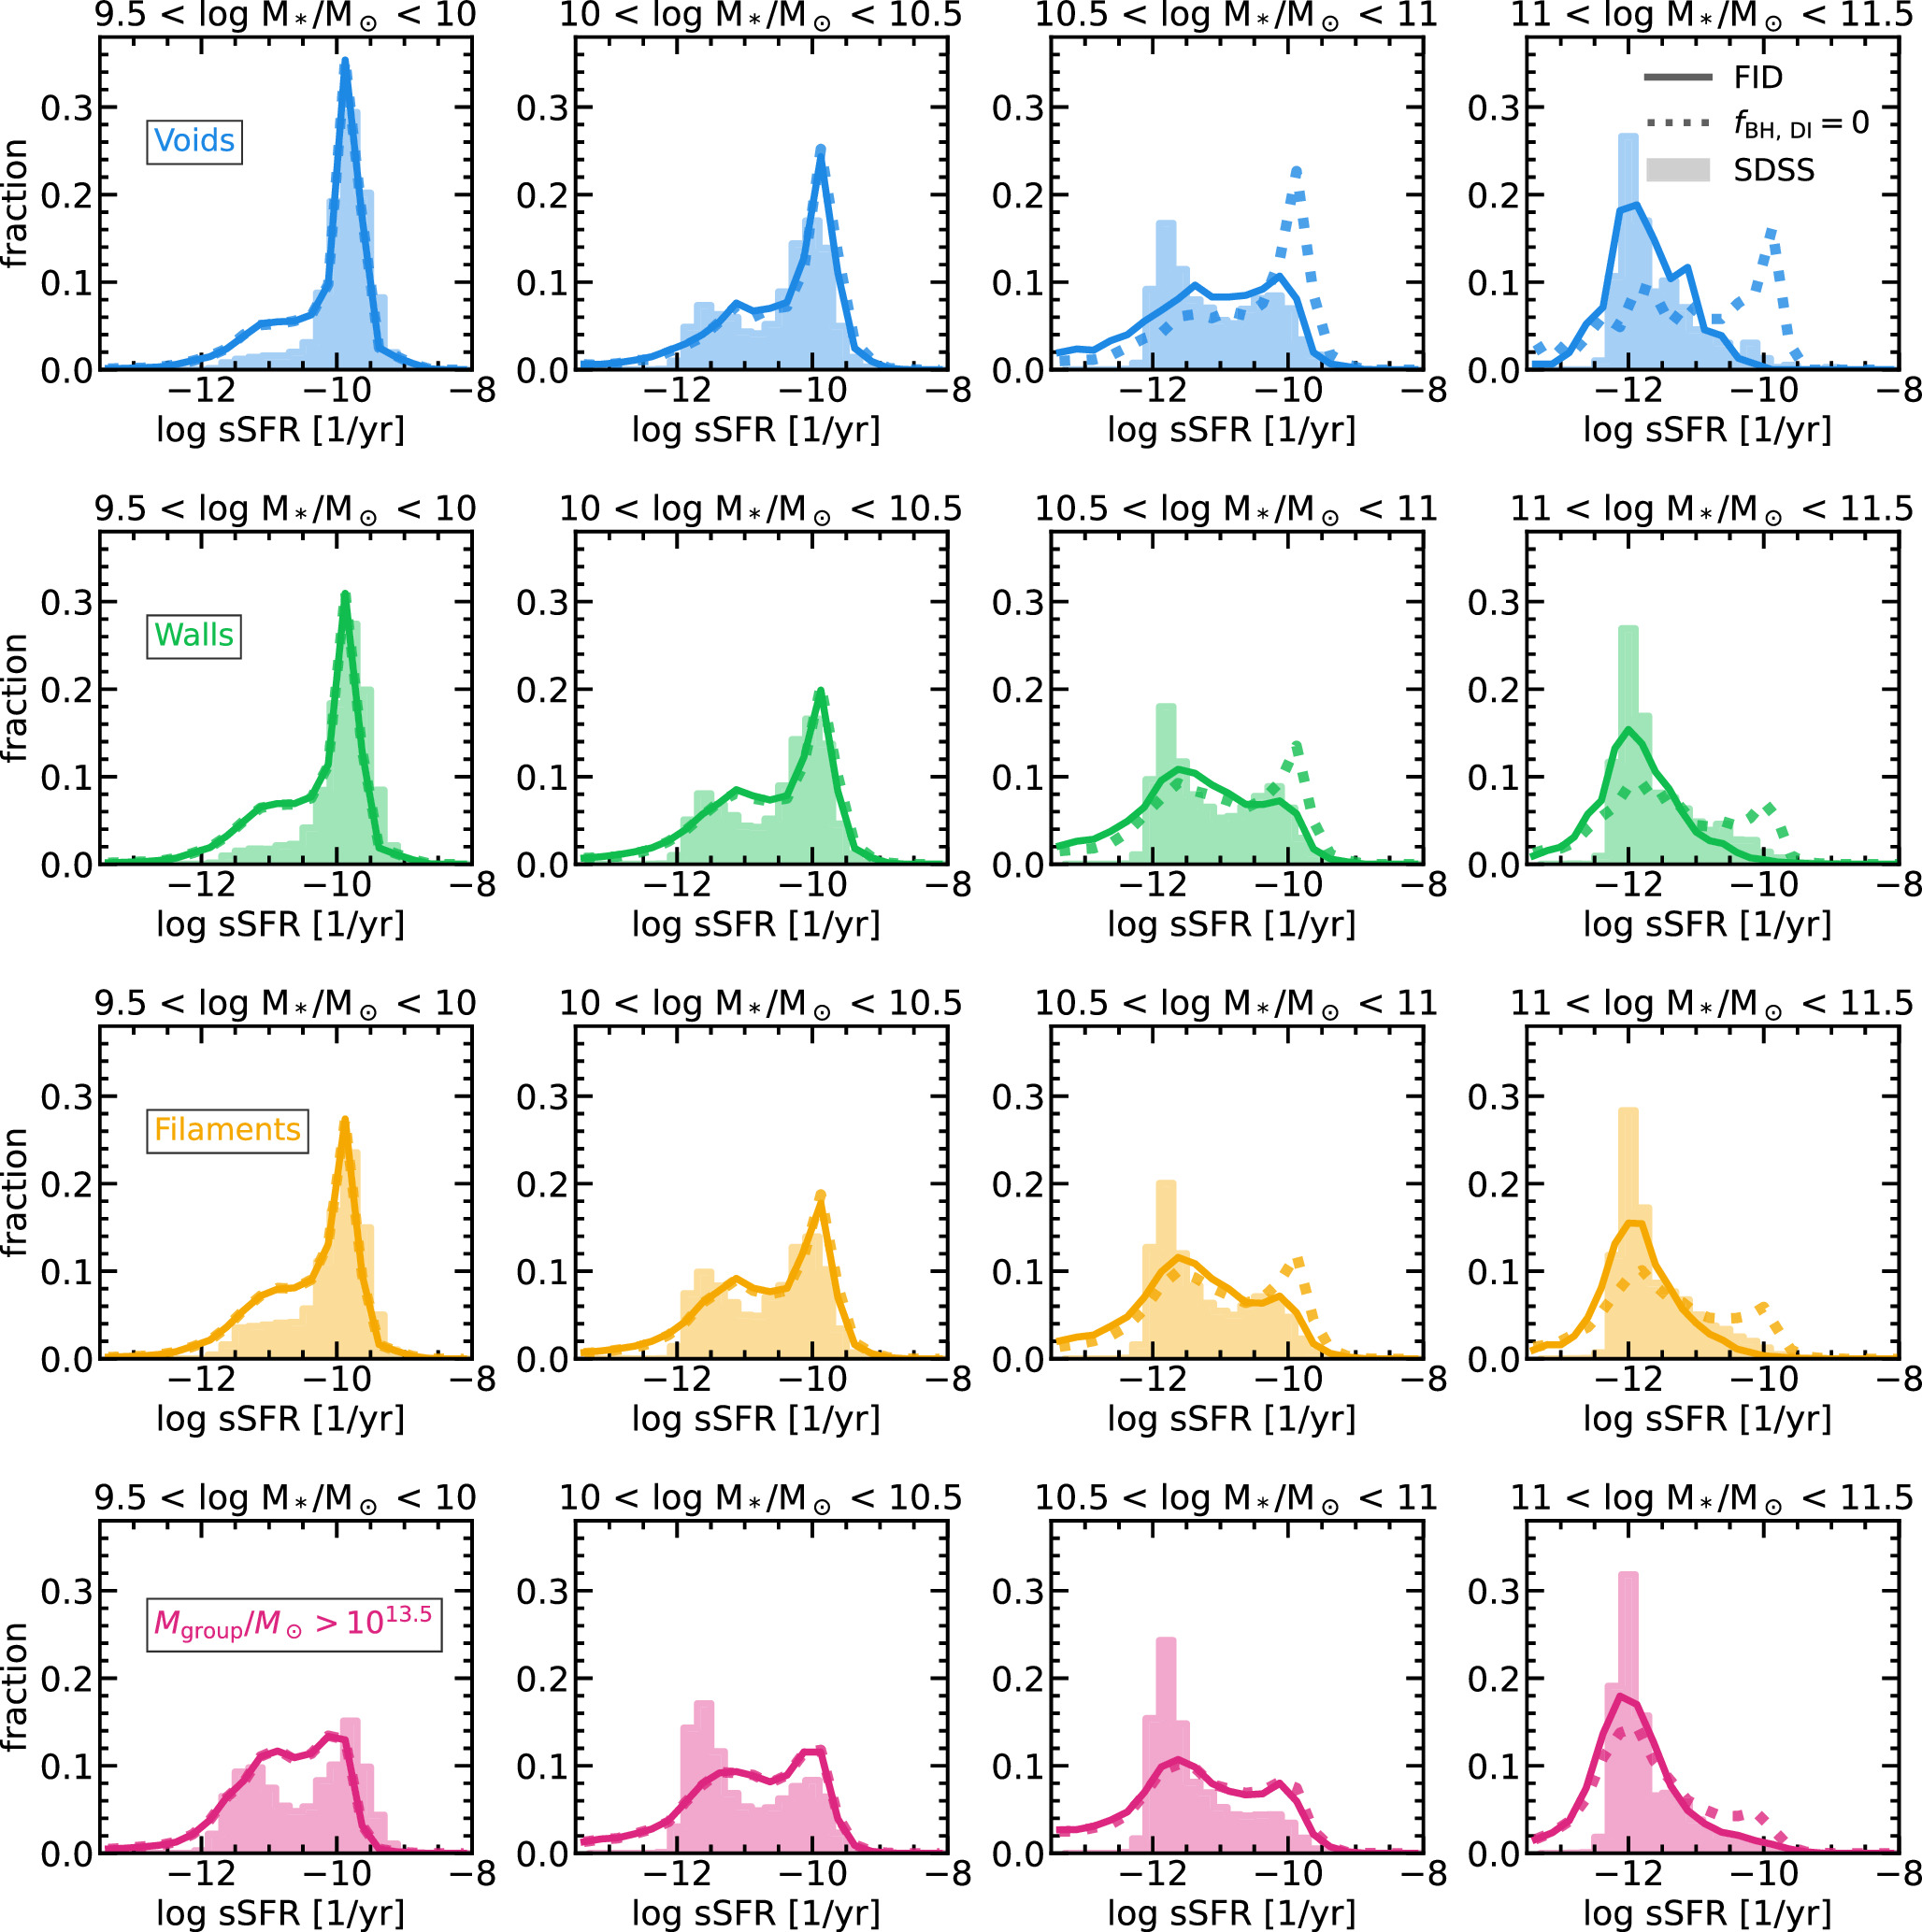
Figure 8. sSFR distributions for galaxies in different stellar mass bins, namely (from left to right) . Results for different cosmic environments are shown, namely (from top to bottom): voids in blue, walls in green, filaments in orange, and massive groups (Mgroup > 1013.5 M⊙) in magenta. We report our model predictions obtained with both the FID and fBH,DI = 0 versions of our SAM (solid and dotted lines, respectively). In each panel, we compare with SDSS data, shown as filled histograms. The environmental classification in both the observed and simulated catalog is performed as detailed in Section 6 (see also Table 2).

Download figure:
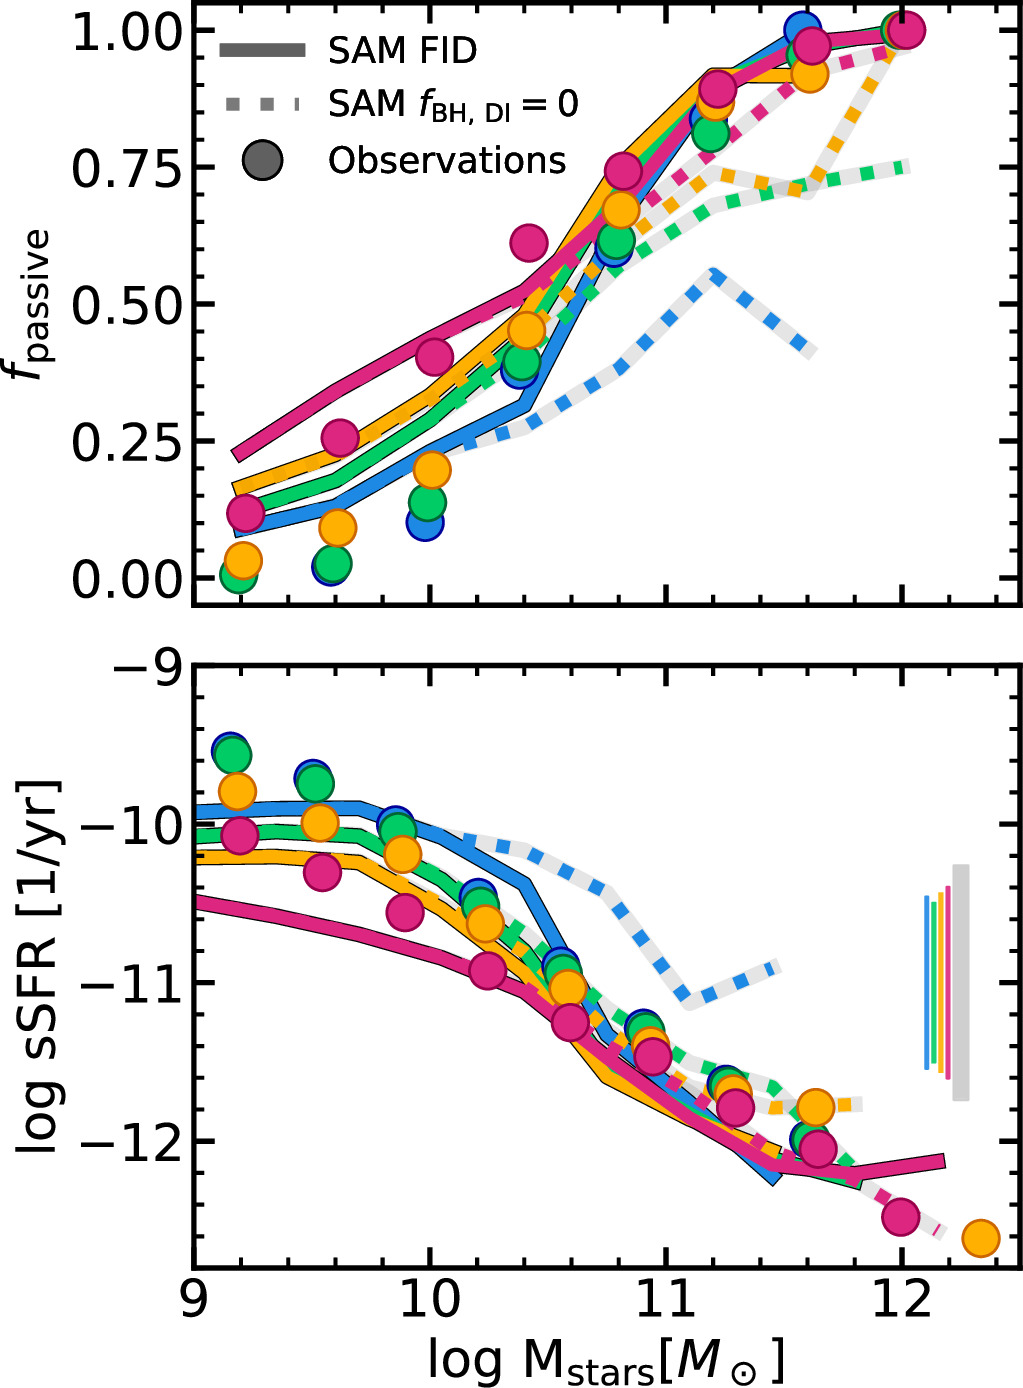
Standard image High-resolution imageFrom the reported observations, it is clear that the larger the stellar mass, the larger the prevalence of the passive population in each environment. This pattern is even more evident when examining the fraction of passive galaxies fpassive (defined as those featuring sSFR < 10−11 yr−1) and the sSFR as a function of stellar mass, both displayed in Figure 9. The observed fpassive (sSFR) increases (decreases) with the density of the environment at fixed stellar mass for Mstars ≲ 1011 M⊙.

Figure 9. Fraction of passive galaxies (sSFR < 10−11 yr−1; top panel) and sSFR (bottom panel) as a function of stellar mass in voids, walls, filaments, and massive groups (Mgroup > 1013.5 M⊙). The colors are as in Figure 8. We report our model predictions obtained with both the FID and fBH,DI = 0 versions of our SAM (solid and dotted lines, respectively). The filled circles refer to observations (SDSS data). We also report the typical 14th–86th dispersion of observations (vertical lines) and of our model (gray shaded rectangle) in the right side of the bottom panel.
Download figure:
Standard image High-resolution imageOur FID model displays similar trends—that is, an increase of fpassive and a decrease of the sSFR with stellar mass and, for Mstars ≲ 1010.8–1011 M⊙, with the density of the environment. The differences between the FID and fBH,DI = 0 outcomes are particularly evident at large Mstars and for low-density environments. In the two most massive stellar mass bins reported in Figure 8, the fBH,DI = 0 model tends to predict more star-forming galaxies than the FID one in both voids and walls. The same holds true when inspecting Figure 9. The voids galaxies in the fBH,DI = 0 model exhibit a too large (small) sSFR (fpassive) with respect to observations at large Mstars. Instead, the FID model aligns well with SDSS observations in this mass regime. Thus, the impact of the SMBH growth during DIs is particularly relevant for star formation quenching in such isolated galaxies.
Also, the passive fraction (and the sSFR, to some extent) of the fBH,DI = 0 model exhibits a clear trend with the environment at any stellar mass. This behavior contrasts with observations, where the environmental trend is observed only up to Mstars ≲ 1011 M⊙. Conversely, the FID model predicts a lack of environmental dependence at large Mstars ( ≳ 1010.8–1011 M⊙), in keeping with the observed pattern.
We conclude that the SMBH growth mechanism adopted by the fBH,DI = 0 model is not sufficient to shut down the star formation in massive, isolated galaxies.
6.2. Dust Mass
Figure 10 compares model predictions of dust masses in local galaxies, as a function of stellar mass and environment, to available observations. The data reported in this section are obtained by matching the SDSS DR16 catalog and the GAMA/H-ATLAS sample, thus the final number of objects is much smaller than the number of SDSS objects shown in the previous section (see Table 2). We focus on the mean trends of the data, which feature a large dispersion, keeping in mind the limited sample size.

Figure 10. Dust–stellar mass relation in different large-scale environments: voids in blue, walls in green, filaments in orange, and massive groups (Mgroup > 1013.5 M⊙) in magenta. The results obtained from our SAM are shown as lines, which refer to medians, while the typical 14th–86th dispersion is shown as a gray shaded rectangle in the upper left of the plot. The solid lines refer to our FID SAM, while the results from the fBH,DI = 0 model are shown as dotted lines. Observations from the GAMA/H-ATLAS sample (Beeston et al. 2018) are shown as filled points, which represent the mean dust mass in stellar mass bins of 0.3 dex width, while the whole sample of observations is shown in the background as the low-opacity circles. We also report the typical 14th–86th percentile dispersion associated with each environment via the vertical lines at the upper left side of the figure. The environments and groups in this figure are identified as detailed at the beginning of Section 6 (see also Table 2).
Download figure:
Standard image High-resolution imageFor Mstars ≲ 1010.5 M⊙, observations suggest that at fixed stellar mass, galaxies are generally more dust-rich in less dense environments, with void galaxies featuring a mean dust content 5 to 10 times larger than massive group objects. The median trends and the environmental differences in this mass range predicted by the FID run of our SAM are consistent with observations.
At larger stellar masses (Mstars ≳ 1010.5 M⊙ in observations and Mstars ≳ 1010.8 M⊙ in our model), dust masses appear to be nearly environment-independent both in observations and in the FID model. By contrast, in the fBH,DI = 0 model, the objects residing in low-density environments feature a far too large median Mdust. This is consistent with the discussion in Section 6.1, according to which the fraction of highly star-forming massive galaxies (likely gas- and dust-rich) is suppressed in low-density environments by the novel in situ SMBH growth.
Although a direct comparison between the convergence mass (Section 5.4) in the SAM and observations is not straightforward, 20 we note that for the observed Mdust curves, convergence occurs around , which is in nice agreement with the results obtained from SAM galaxies.

7. Summary and Conclusions
In this work, we study the dependence of local galaxy properties, mainly sSFR and dust, on the large-scale environment, at fixed stellar mass. We adopt the simulated galaxy catalog produced by the SAM introduced in P23, which is an extension of the L-Galaxies SAM (Henriques et al. 2020). This version includes a state-of-the-art model of dust production and evolution in galaxies, as well as an updated treatment of the bulge and SMBH growth during DIs. We identify cosmic web environments from the underlying DM simulation exploiting different methods. We employ NEXUS+ (Cautun et al. 2013) as a comprehensive method for dissecting the cosmic web into voids, walls, filaments, and nodes. This approach provides us with a unified framework to identify different cosmic environments. In contrast, we also utilize specific algorithms tailored for distinct environments: the method introduced by Ruiz et al. (2015, 2019) for identifying spherical voids and associated walls, the approach outlined in Taverna et al. (2023) for detecting cylindrical filaments, and the well-known FOF halo finder to pinpoint massive groups (Mgroup > 1013.5 M⊙), representing the most dense environments.
First, we study galaxy properties as a function of Mstars to highlight the role of the environments (Section 5.1). For galaxies with Mstars ≲ 1010.8 M⊙, we find a clear and systematic trend: at fixed stellar mass, galaxies in less dense environments feature a larger specific SFR and dust abundance. Contrarily, differences among environments are much less evident in more massive objects.
We interpret these results in light of the evolution of galaxies with the same z = 0 stellar mass, but residing in different environments (Section 5.2). At , the less dense the environment, the slower the stellar mass evolution. At a given , galaxies in less dense environments feature an SFR peak at more recent times, ending up with a larger SFR and dust content. Contrarily, galaxies in more dense environments are in the declining phase of their star formation activity. Thus, void galaxies host, on average, younger stellar populations that are more star-forming and dust-rich with respect to galaxies located in other environments with the same . Relevant differences in the stellar mass assembly are not observed for more massive galaxies , and this is in keeping with the environment insensitivity of star formation and dust for massive objects, as already discussed. This finding is remarkably robust, irrespective of the variety of methods for environmental identification adopted in this work.


The picture resulting from our model suggests that galaxy properties are affected by the large-scale environment up to a certain threshold mass. The key to interpreting this finding stands in the SMBH growth channel during DIs, which is adopted in our model. This channel enables the growth of SMBHs even in isolated galaxies, allowing them to halt star formation through AGN radio-mode feedback. In the absence of this channel, the growth of SMBHs in isolated objects is significantly discouraged, as the other prominent growth channel in our SAM occurs during merger events. This in situ SMBH growth tends to erase differences among galaxies that exceed a specific stellar mass (Mstars ≃ 1010.8 M⊙, the mass above which the SMBH-driven quenching becomes relevant in our model) residing in different environments.
Finally, we test our results against observations (Section 6). We identify different environments in SDSS DR16, namely spherical voids, their associated walls, cylindrical filaments, and massive groups (Mgroup ≳ 1013.5 M⊙), using the algorithms by Ruiz et al. (2015), Taverna et al. (2023), and Rodriguez & Merchán (2020). This is conceptually similar to the identification process in our SAM catalog, allowing us to compare the results. The fraction of passive galaxies (sSFR < 10−11 yr−1) with Mstars ≲ 1010.5–1011 M⊙ increases with the increasing density of the environment, in both the SAM and SDSS catalog. As for the most massive objects (Mstars ≳ 1010.5–1011 M⊙), in both our model and observations, we do not find any sign of a prominent star-forming population in any environment. This is a direct consequence of the DI-driven SMBH growth adopted in our model. Without this channel (fBH,DI = 0), our model would produce a prominent star-forming population among massive void galaxies, and this is not present in the observed sample (Figures 8 and 9).
We perform a similar comparison between our model and observations (combining the SDSS DR16 and GAMA/H-ATLAS surveys) in the Mstars–Mdust plot (Figure 10). We find a good match—namely, the less dense the environment, the larger the dust content of galaxies with Mstars ≲ 1010.5 M⊙ in observations (Mstars ≲ 1010.8 M⊙ in our model). The ∼0.5–1 dex difference in the mean dust mass of void and massive group galaxies is not observed above this mass. Again, this confirms the importance of the SMBH growth channel in DIs, without which too-dust-rich void galaxies would be predicted.
We draw two main conclusions from this work. First, we confirm the relevance of the secular process of SMBH growth during DIs in our SAM, since it causes the quenching of galaxies in isolated environments. The importance of this growth channel has also been pointed out by recent observational and simulation-based investigations, whose claim is that secular processes dominate over mergers in growing the central SMBH (e.g., Martin et al. 2018; Smethurst et al. 2019). The second conclusion concerns our approach more than our results. Investigating the properties of galaxies in different large-scale environments may be a useful tool for constraining the relevance of in situ and ex situ processes in shaping galaxy evolution.
The method outlined here can be improved in various ways—for example, by striving for a more accurate match between the environments identified in simulations and observations. A possible way to achieve this may be to identify environments from mock catalogs derived from the SAM (or from hydrodynamical simulations as well) to mimic the identification process performed on the observed catalog as closely as possible.
In any case, besides any possible improvements, the role of future observational surveys such as Euclid (Laureijs et al. 2011), DESI (DESI Collaboration et al. 2016), and LSST (Ivezić et al. 2019), will be crucial. They will substantially advance our knowledge of the large-scale structure and, concomitantly, deepen our insight into the evolution of galaxies within distinct cosmic environments.
Acknowledgments
We thank the anonymous referee for the constructive report and the suggestions that improved the clarity of our work.
We acknowledge Agustín M. Rodríguez-Medrano for sharing the observed catalog of voids and Angus H. Wright for directing us to the GAMA catalog. We thank Robert M. Yates for carefully reading the manuscript and providing constructive comments. M.P. is grateful to Lumen Boco for his stimulating comments and to Meriem Behiri for help in dealing with observational catalogs.
This project has received funding from the European Union's HORIZON-MSCA-2021-SE-01 Research and Innovation program under the Marie Skłodowska-Curie grant agreement No. 101086388—project acronym: LACEGAL, from Consejo Nacional de Investigaciones Científicas y Técnicas (CONICET) (PIP-2021 11220200102832CO and PIP-2022 11220210100064CO), and from the Ministerio de Ciencia, Tecnología e Innovación (PICT-2020 03690) de la República Argentina.
Simulations have been carried out at the computing center of INAF (Italy). We acknowledge the computing center of INAF Osservatorio Astronomico di Trieste, under the coordination of the CHIPP project (Bertocco et al. 2019; Taffoni et al. 2020), for the availability of computing resources and support.
Software: Astropy (Astropy Collaboration et al. 2013, 2018, 2022), TOPCAT (Taylor 2005), L-Galaxies (Henriques et al. 2020).
Appendix A: Environmental SMF and Satellite Fraction
Here we present the SMF and the number abundance of type 0, 1, and 2 galaxies (respectively, centrals, satellites, and orphans 21 in the L-Galaxies framework) for different cosmic environments at z = 0. We report the cosmic environments we focus on in the paper: voids, walls, filaments, and nodes, as identified by NEXUS+, as well as spherical voids and their associated walls, cylindrical filaments, and massive groups (R19+T23+FOF). The results are shown in Figure 11. We also perform a fit of the SMFs with a Schechter function (Schechter 1976):

where and . The latter is a parameter often referred to as the characteristic mass. We report this parameter of the SMFs of different environments in Table 3.


Figure 11. SMF (left panels) and number fraction of simulated galaxies of type 0 (centrals; green), type 1 (satellites; purple), and type 2 (orphans; pink) (right panels) at z = 0.0 for different environments. The top panels show the predictions for environments as identified by NEXUS+ (voids, walls, filaments, and nodes), while the bottom panels report the other environmental definitions adopted in this work, namely spherical voids and their walls, cylindrical filaments, and massive groups (R19+T23+FOF). The SMF of the whole sample of galaxies is also shown as a dashed gray line for reference.
Download figure:
Standard image High-resolution imageTable 3. Characteristic Mass, Derived with a Schechter Fit, for the SMFs of the Different Environments Discussed in the Main Text
| Environment | Environment | ||
|---|---|---|---|
| Voids | 10.66 | Spherical voids | 10.59 |
| Walls | 10.84 | Spherical void walls | 11.02 |
| Filaments | 10.92 | Filaments (T23) | 11.02 |
| Nodes | 11.64 | Massive groups | 11.67 |


Note. The SMFs are shown in Figure 11.
Download table as: ASCIITypeset image
As for the NEXUS+ SMF, the denser the environment, the larger the number of massive galaxies (the same is observed for the halo mass function; see, e.g., Figure 17 of Cautun et al. 2013). The characteristic mass of the SMF also increases with the density of the environment (Table 3). The node SMF exhibits a feature at log Mstars/M⊙ ≃ 11.5. This is due to one of the parameters required by NEXUS+, the minimum mass for a cell to be classified as a node (Mvir ≥ 2 · 1014 M⊙ here; about Mstars ≳ 2.5 · 1011 M⊙). For this reason, every cell containing objects that meet this criterion will automatically be classified as a node.

Also, the relative fractions of the central, satellite, and orphan galaxies are sensitive to the environment (top right panel of Figure 11). The denser the environment, the smaller the number of central (type 0) galaxies. More dense environments, particularly nodes, typically host more groups and clusters of galaxies, and this explains the progressively larger number of satellite (and orphan) galaxies.
A similar pattern is observed when comparing R19+T23+FOF environments (bottom panels). We note that in this case, the wall galaxies are typically more massive than the filaments, and also host a lower fraction of central (type 0) galaxies.
Appendix B: Dust Properties across Environments
Here we analyze the dust properties of galaxies in different environments. Namely, we look at the DTG, small-to-large (S-to-L), and silicate-to-carbonaceous (Sil-to-C) ratios as a function of stellar mass. These quantities are particularly relevant, as they are strongly dependent on the grain accretion process in galaxies (e.g., Hirashita & Kuo 2011; Aoyama et al. 2017; Parente et al. 2022; Yates et al. 2024). In particular, in our model, the accretion process boosts the DTG ratio, as well as the silicate and small grain abundance (the latter up to a certain mass when coagulation becomes more efficient; see also, e.g., Hou et al. 2019).
The results are shown in Figure 12. Although, to a lesser extent, the environment still has an impact on these properties, at fixed Mstars, the denser the environment, the larger the DTG, S-to-L, and Sil-to-C ratios at log Mstars/M⊙ ≲ 10.8. This is particularly evident for the galaxies in nodes—the curve that deviates the most from the others. However, this behavior is mainly due to the contribution of satellite galaxies, which are more abundant in dense environments, especially orphan galaxies (see Figure 11). Indeed, when looking at the same relations for central galaxies only (type 0), the differences among environments are strongly suppressed (not shown here).

Figure 12. DTG (left panel), S-to-L (middle panel), and Sil-to-C (right panel) ratios as a function of stellar mass, in different cosmic web environments. We report the results for NEXUS+ environments (voids, walls, filaments, and nodes; top panels), as well as for the other environmental definitions adopted in this work, namely spherical voids and their walls, cylindrical filaments, and massive groups (R19+T23+FOF; bottom panels).
Download figure:
Standard image High-resolution imageThus, the enhancement of the DTG ratio at low masses (as well as of the S-to-L and Sil-to-C ratios) toward denser environments is strictly related to the treatment of satellites within the SAM. These objects are subject to hot gas stripping. Moreover, orphan galaxies (type 2) have no hot gas at all. As a result, in satellite galaxies, hot gas cooling is strongly (often totally) suppressed, and consequently the cold gas metallicity is not diluted by the inflow of (almost) pristine material. Thus, the larger cold gas metallicity of these objects enhances the grain accretion and, consequently, the DTG ratio, silicate, and small grain abundance.
At , the trends reverse, with galaxies in denser environments featuring lower values of the DTG, S-to-L, and Sil-to-C ratios. The large majority of galaxies in this mass range are central galaxies (type 0), which are quenched by the SMBH radio-mode feedback. Consequently, a significant number of galaxies experience a substantial decrease in their molecular gas fraction, inhibiting the grain accretion process and the conversion of gas-phase metals into dust grains (a process that would lead to a DTG increase). Importantly, the prevalence of galaxies with a low molecular gas fraction is linked to the environment, with approximately ∼95% of galaxies in nodes (and ∼40% in voids) featuring for Mstars ≳ 1011 M⊙. Indeed, galaxies in denser environments typically start to be quenched at earlier times, ending up at z = 0 with a lower gas, and a lower H2, content. We also observe this reversal of trends in the S-to-L and Sil-to-C ratios, which are also influenced by the accretion process.


Footnotes
- 9
The source code is available at https://github.com/LGalaxiesPublicRelease/LGalaxies_PublicRepository/releases/tag/Henriques2020.
- 10
This means setting fBH = 0 in Equation (23) of P23.
- 11
- 12
Normalized to the z = 0 value.
- 13
The efficiency of the accretion process is delayed with respect to the dust production by stars also on a cosmic scale, as can be appreciated in Figure 11 of P23.
- 14
- 15
Actually, the number of mergers experienced by a galaxy up to a certain redshift also depends on the time a galaxy needs to merge once its associated DM subhalo has merged. In our SAM, such a merging time is estimated with the dynamical friction timescale (Binney & Tremaine 1987), as detailed in Section S1.16.1 of the supplementary material of Henriques et al. (2020).
- 16
We clarify that the SMBH growth during DIs is not a novelty in the panorama of SAMs, since it has been adopted by the community for a long time (e.g., Croton et al. 2016; Lacey et al. 2016; Lagos et al. 2018), also in the context of the same L-Galaxies model (Irodotou et al. 2019; Izquierdo-Villalba et al. 2020). The wording novel adopted here has to be intended as novel with respect to the public release of the L-Galaxies SAM (Henriques et al. 2020).
- 17
Nonetheless, we note that our model still reproduces many crucial properties of the galaxy population, including the SMF, which is only mildly affected by the DI model (Section 3.1 of P23).
- 18
A similar approach can be applied to the Mstars–Mdust relation.
- 19
But maintaining its functional dependence on the halo virial velocity.
- 20
This would need to identify environments in mock catalogs from the simulated galaxy sample in the same way that we do from the observed sample. Also, due to the lower number of objects in the observed catalog, the accuracy of its calculation in observations is somewhat unreliable.
- 21
Orphan galaxies are objects that have already lost their DM halo, but still have a baryonic component.