


Abstract
Post-merger galaxies are unique laboratories to study the triggering and interplay of star formation and active galactic nucleus (AGN) activity. Combining new, high-resolution Jansky Very Large Array (VLA) observations with archival radio surveys, we have examined the radio properties of 28 spheroidal post-merger galaxies. We detect 18 radio sources in our post-merger sample and find a general lack of extended emission at (sub)kiloparsec scales, indicating the prevalence of compact, nuclear radio emission in these post-merger galaxies, with the majority (16/18; 89%) characterized as low luminosity. Using multiwavelength data, we determine the origin of the radio emission, discovering 15 new radio AGNs and three radio sources likely associated with star-forming (SF) processes. Among the radio AGNs, almost all are low luminosity (13/15; 87%), inconsistent with a relativistic jet origin. We discover a new dual AGN (DAGN) candidate, J1511+0417, and investigate the radio properties of the DAGN candidate J0843+3549. Five of these radio AGNs are hosted by a SF or SF-AGN composite emission-line galaxy, suggesting that radio AGN activity may be present during periods of SF activity in post-mergers. The low-power jets and compact morphologies of these radio AGNs also point to a scenario in which AGN feedback may be efficient in this sample of post-mergers. Lastly, we present simulated, multifrequency observations of the 15 radio AGNs with the Very Long Baseline Array and the very-long-baseline interferometry capabilities of the Next-Generation VLA to assess the feasibility of these instruments in searches for supermassive black hole binaries.

Original content from this work may be used under the terms of the Creative Commons Attribution 4.0 licence. Any further distribution of this work must maintain attribution to the author(s) and the title of the work, journal citation and DOI.
1. Introduction
Theoretical studies predict that galaxy mergers are the main contributor to the buildup of stellar mass in galaxies and to the formation of bulges and massive elliptical galaxies (Springel 2000; Cox et al. 2008; Di Matteo et al. 2008; Torrey et al. 2012). Integral to this evolution is what role galaxy mergers have in the triggering of an active galactic nucleus (AGN) and/or intense starburst activity. Early studies of ultra-luminous infrared galaxies (ULIRGs), which are at least partially powered by a heavily obscured AGN (Lonsdale et al. 2006), found a nearly ubiquitous fraction hosted by interacting galaxy systems (Murphy et al. 1996; Veilleux et al. 2002). These early works suggested that ULIRGs are triggered by galaxy-merger-induced processes. Likewise, intense starburst activity has been observed in merging systems (Tacconi et al. 2008). For both cases, the triggering of these phenomena are caused by nuclear inflows of gas produced by gravitational torques during the merger process (Hopkins et al. 2006), linking the growth of supermassive black holes (SMBHs) and their host galaxies. Indeed, observed correlations between the SMBH and host galaxy properties confirm their coevolution (Kormendy & Richstone 1995; Magorrian et al. 1998; Ferrarese & Merritt 2000; Gebhardt et al. 2000; Tremaine et al. 2002; Gültekin et al. 2009; McConnell & Ma 2013; Sahu et al. 2019). Thus, detailed studies of galaxy mergers at various stages of evolution are needed to fully realize the astrophysical processes governing these phenomena.
Observational studies are in conflict with one another over the role mergers play in triggering an AGN. While many have found either an increased AGN fraction in merging systems (Ellison et al. 2011; Satyapal et al. 2014; Donley et al. 2018; Goulding et al. 2018) or an increased merger fraction in AGN hosts (Chiaberge et al. 2015; Fan et al. 2016; Gao et al. 2020; Marian et al. 2020; Breiding et al. 2024), others have found no such connection between AGNs and mergers (Grogin et al. 2005; Cisternas et al. 2011; Böhm et al. 2013; Villforth et al. 2017; Marian et al. 2019; Lambrides et al. 2021). Selection biases almost certainly contribute to this dissonance. Different AGN selection criteria, e.g., mid-infrared (mid-IR; e.g., Satyapal et al. 2014; Donley et al. 2018; Goulding et al. 2018), X-ray (e.g., Grogin et al. 2005; Villforth et al. 2017), optical (e.g., Böhm et al. 2013), and radio (e.g., Chiaberge et al. 2015; Breiding et al. 2024), and selection of mergers at various stages of their evolution also necessarily select different astrophysical scenarios (e.g., Sanders et al. 1988).
Among the evolutionary stages of merger systems, post-merger galaxies, those in which the stellar nuclei have coalesced, perhaps present the most unique laboratories to study these triggering mechanisms and the effects of AGN feedback on star formation as a result of the advanced stage of the merger. Small samples of post-merger systems have found hints at enhancement in the star formation rate (SFR; Ellison et al. 2013) and AGN incidence over galaxies in close pairs (Carpineti et al. 2012; Bickley et al. 2023). The effectiveness of AGN feedback, however, is questioned when examining post-merger galaxies. Post-mergers appear to host a significantly higher fraction of post-starburst galaxies (Ellison et al. 2022; Li et al. 2023), characterized as having recently experienced intense star formation activity that was rapidly truncated (Couch & Sharples 1987), although this itself does not imply that an AGN is the main driver of this quenching. Indeed, this low-efficiency scenario is corroborated by the works of Kaviraj et al. (2015) and Shabala et al. (2017). Both of these studies determined that the onset of merger-triggered AGN activity is delayed with respect to the peak of starburst activity, significantly limiting its ability to impact the SFR of the host galaxy. Central to this paradigm is the discovery and characterization of the low-luminosity radio-emission progenitors in these post-merger galaxies. Previous studies have suggested that the flattening of the radio luminosity function at low radio power (P1.4 GHz ≤ 4 × 10²³ W Hz−1) is indicative predominantly of star formation processes (Kimball et al. 2011; Condon et al. 2013), though differentiating between star formation and AGN progenitors poses a challenging task at these radio powers (see the reviews by Padovani 2016 and Panessa et al. 2019). Historically, the distinctions in radio power have been classified as the radio-loud versus radio-quiet AGN dichotomy, with empirically derived characteristics serving as the boundaries between the two classes (Strittmatter et al. 1980; Miller et al. 1990). However, recent work has been seminal in providing astrophysically motivated models, including relativistic or weak jets, disk winds, coronal emission, and star formation processes, to account for the observed broad range in radio power (e.g., Orienti et al. 2015; Raginski & Laor 2016; Hwang et al. 2018; Chen et al. 2023). To this end, we utilize the terms "jetted AGN" in place of "radio-loud," and "low-luminosity radio emission" in place of "radio-quiet" to define a radio progenitor inconsistent with the classic relativistic jet scenario. Then, it is crucial to identify and characterize these weak radio emitters, to not only better understand the nature of their emission but to study their chronology and evolutionary effects in post-merger galaxies.
Post-merger galaxies are also ideal targets in which to search for supermassive black hole binaries (SMBHBs). As all massive galaxies are believed to harbor a SMBH (Kormendy & Ho 2013), a major galaxy merger should lead to the formation of a SMBHB. At the initial stages of SMBHB evolution, dynamical friction is the dominant mechanism through which the SMBHs lose energy and momentum (Begelman et al. 1980), eventually settling into the gravitational center of the merger remnant. Simulations of galaxy mergers have found that this phase of the evolution may be as short as 1 Gyr (Dosopoulou & Antonini 2017; Kelley et al. 2017), shorter than the timescale over which the bulges will centralize. Thus, by the time the stellar nuclei have merged, the resident SMBHs are likely to already reside in the gravitational center of the merger remnant (see Dvorkin & Barausse 2017; Kelley et al. 2017). At parsec-scale separations, the SMBHs will form a gravitationally bound SMBHB. Here, several different processes, of varying efficiency, are hypothesized to contribute to the shrinking of the binary's orbit, the so-called "last parsec" problem. If the SMBHB is able to overcome the last parsec, it will reach subparsec orbital separation, where the emission of low-frequency gravitational waves will efficiently bring the binary to merger. Thus, establishing a population of observed SMBHBs at various orbital separations is key toward our understanding of the nanohertz gravitational-wave population, which will soon be probed by pulsar timing arrays (Agazie et al. 2023a, 2023b). Critical to this aspect, however, is the poorly understood evolution of SMBHBs themselves. Low efficiency at parsec scale can create a scenario in which binaries at these orbital separations are still present in the post-merger host galaxy. Observations of galaxy mergers at this post-merger phase must be taken to better understand SMBHB evolution.
In this paper, we present a multiwavelength analysis of 28 galaxies identified as post-mergers in Galaxy Zoo to study their emission mechanisms. The paper is organized as follows. Section 2 presents the post-merger sample. Section 3 describes new 10 GHz observations taken with the Karl G. Jansky Very Large Array (VLA) of this post-merger sample, while in Section 4, we describe the multifrequency data obtained via archival radio surveys. The optical emission-line classifications of each post-merger galaxy, and the radio luminosities, morphologies, and spectra of these sources are presented in Section 5. In Section 6, we present analyses to determine the origin of the radio emission in our 10 GHz-detected post-merger galaxies. We then discuss the prevalence of low-luminosity emission in these post-mergers, the impact of AGN feedback in radio AGN hosts, and the properties of the star-formation-dominated radio sources in Section 7. Lastly, in Section 8, we present simulated, multifrequency observations of the radio AGNs with the Very Long Baseline Array (VLBA) and the very-long-baseline interferometry (VLBI) capabilities of the Next-Generation VLA (ngVLA) to assess the feasibility of SMBHB searches for these post-merger galaxies. Our results are summarized in Section 9.
Throughout this paper, we have adopted a Lambda cold dark matter (ΛCDM) cosmology with H0 = 67.4 km s−1 Mpc−1 and Ωm = 0.315 (Planck Collaboration et al. 2020). We use the radio spectral index convention Sν ∝ να .
2. Sample
Our sample consists of 28 of the 30 spheroidal post-merger (SPM) galaxies presented by Carpineti et al. (2012, hereafter C12). The C12 sample was selected from the larger sample of Darg et al. (2010). These authors constructed a catalog of 3003 local (0.005 < z < 0.1) galaxy merger systems identified through visual inspection via the Galaxy Zoo project (Lintott et al. 2008). Of these 3003 merging systems, 370 were considered strongly perturbed, i.e., contained the presence of strong tidal tails, but could not be clearly divided into a pair of two interacting galaxies. From the parent sample of 370 late-stage merger systems, C12 selected their sample of 30 SPM galaxies via the distinct visual characteristics of SPMs: SPM galaxies are defined as a single galaxy that displays morphological disturbances associated with a recent merger event, e.g., tidal tails, and contain only a single dominant bulge, making them the likely progenitors of early-type galaxies. As a consistency check, after visual inspection of each SPM candidate, C12 utilized the Sloan Digital Sky Survey (SDSS) parameter fracdev in the optical r band for a quantitative representation of the bulge-dominant nature of each system. fracdev represents the likelihood of the surface-brightness distribution to be fit by a de Vaucoulerus profile: pure bulge systems have a value of 1, pure exponential or disc-like distributions have a value of 0. All of the 30 SPM galaxies have fracdev > 0.5, signifying they are bulge dominated, with most having fracdev ≥ 0.8. Further, the 30 SPM systems are all of high stellar mass , typical of early-type galaxies. Additionally, C12 found that these 30 SPM systems are diverse in their large-scale environments. Using the environment parameter ρg defined by Schawinski et al. (2007a), C12 found two SPM systems which inhabit a cluster environment, 19 in a group environment, and nine in a field environment.

3. Observations and Data Calibration
High-resolution, Karl G. Jansky VLA observations of the 30 SPM galaxies were taken from 2016 to 2022. J1018+3613 was observed on 2016 May 26 (Project ID: 16A-475; PI: S. Burke-Spolaor) using the S- (2–4 GHz) and X-band (8–12 GHz) receivers of the VLA while in its B configuration. 3C 186 was used for flux density and bandpass calibration and J1018+3542 was used to perform phase referencing. J0206−0017, J1445+5134, J1511+0417, J1511+2309, and J1655+2639 were observed in two observing programs on 2020 November 15 and 2020 December 11 and 12 (Project IDs: 19A-472 and 20B-298; PI: P. Breiding) using the S- and X-band receivers of the VLA while in its BnA and A configurations. 3C 286 and 3C 138 were used for flux density and bandpass calibration and a nearby phase-reference calibrator for phase calibration of each target. We obtained observations for the remaining 24 SPM galaxies on 2022 May 19 and May 28 (Project ID: 22A-376; PI: G. Walsh) using the X-band receiver of the VLA with 4 GHz bandwidth while in its A configuration. We observed 3C 147 and 3C 286 for flux density and bandpass calibration and a nearby phase-reference calibrator for phase calibration of each target. Our observations were designed to reach a nominal image rms sensitivity of <15 μJy beam−1 for each target, with a 3σ detection threshold of <45 μJy beam−1. Although we observed all 30 of the C12 SPMs, we did not include the SPMs J0908+1407 and J0933+1048 in our analyses due to insufficient time on source as a result of antenna cable unwrapping during our observations. These data were automatically flagged during the observation.
Four of the five data sets were calibrated by the VLA calibration pipeline. 3 The VLA calibration pipeline could not be used for the observing session containing J0908+1407 and J0933+1048 due to automatic flagging of these data. We manually calibrated this data set following standard calibration routines. To check for calibration consistency between the pipeline-calibrated data set and this one, we calibrated the former with our manual calibration routine as well. We achieved identical results using both calibration methods for this data set.
The data were inspected, flagged, calibrated, and imaged in the Common Astronomy Software Applications (CASA; The CASA Team et al. 2022) package. To account for the large fractional bandwidths at each band, ∼60% and ∼40% respectively, for the S and X bands, we used multi-Taylor, multifrequency synthesis deconvolution (Rau & Cornwell 2011) when cleaning our images. Because of the limited UV coverage from our observations, we utilized a Briggs weighting scheme (Briggs 1995) with a robustness parameter of 0.7 to suppress the sidelobes present in images of moderately strong sources (Sν
> 1 mJy). Otherwise, we used a natural weighting scheme when imaging. We performed phase and amplitude self-calibration on each of the phase-reference sources to improve calibration quality, and on sufficiently bright (Sν
> 1 mJy) target sources. For sources observed in the A configuration (27/28), the average clean beam size at 10 GHz was θavg = 0 32 × 021 with an average image rms sensitivity of σavg = 14.2 μJy beam−1. For J1018+3614, observed in the B configuration, the clean beam size at 10 GHz was θ = 064 × 063 with an image rms sensitivity of σ = 10.2 μJy beam−1.
4. Radio Surveys
We wish to construct a broadband radio spectrum for each of the 28 SPM galaxies in our survey. In this section, we describe the surveys used to construct each spectrum.
It is important to note that each survey, observed at a different frequency and with a different angular resolution, is by nature sensitive to different forms of radio emission and may or may not suffer from source confusion. Low-frequency (<1 GHz) surveys are more sensitive to diffuse emission, likely associated with star formation, and are more likely to suffer from source confusion due to their larger resolution elements. High-frequency surveys, in contrast, generally resolve out this same extended, diffuse emission, making them good identifiers of compact radio jets and cores, features associated with an AGN. However, the difference in angular scale probed by these frequencies can create an artificial steepening of the radio spectrum due to the high-frequency surveys missing flux density information recovered at lower frequency for diffuse emission, or confusion from background source blending.
We attempted to mitigate the effects of source confusion and artificial spectral steepening by visual inspection of the survey intensity map for each source, and, when possible, comparison of matched-frequency flux density measurements at distinct angular resolutions. Because we aim to characterize the compact emission features, background source confusion is unlikely at the angular resolutions probing this emission, and, indeed, we found no evidence for this in our analyses. Few of our sources show evidence of extended low-surface-brightness emission in their intensity maps (see the Appendix) or comparison of matched-frequency flux density measurements (see Section 5.4) that would contribute to artificial spectral steepening. However, at higher frequencies, in particular 3 and 10 GHz, there is a nonzero contribution to the integrated flux density from resolved features for a number of radio sources (see Section 5.3). Artificial spectral steepening is likely to occur for these resolved sources, as the absence of short baselines at higher frequency will systematically bias the recovered flux density to lower values. We discuss this effect to the relevant sources in Section 5.4.
Lastly, for each radio survey we considered a source to be detected if it was found in an available source catalog, e.g., LoTSS, RACS, and FIRST, or the signal-to-noise ratio (S/N) in the respective survey image was >5σ, where σ is the local image rms noise. In some cases, a source was identified at only a 3σ significance. We considered the 3σ source a true detection if it was spatially coincident with a source of ≥5σ detection in any of the other radio surveys. Each image was inspected visually to assure that no sources were missed. It is important to distinguish this to properly account for the difference in sensitivities between the various radio surveys used. If we only classified sources at the 5σ level and greater, our multifrequency analyses would be incomplete and not truly representative of the radio population of our SPM sample within the limits of each survey. The 10 GHz map of J1015+3914, presented in Figure A6, illustrates this point. The diffuse, 3σ emission at 10 GHz would not by itself be substantial for a detection. However, J1015+3514 is detected at high S/N in all other surveys that observed it, and this diffuse 10 GHz emission is spatially coincident with those detections. For this reason, we consider the 10 GHz source a true detection and include it as part of our analyses.
For 3σ sources, we determined the flux density by performing a two-dimensional Gaussian fit to the observed radio emission using the task IMFIT in CASA.
4.1. LoTSS
The LOw Frequency ARray (LOFAR; van Haarlem et al. 2013) Two Meter Sky Survey (LoTSS; Shimwell et al. 2022) is an ongoing survey covering the northern sky above +34° conducted at a central observing frequency of 144 MHz. For our analysis, we use the second data release (DR2), which covers 27% of the northern sky with a resolution of 6'' and median rms sensitivity of 83 μJy beam−1. 4 Sixteen of the 28 SPM galaxies in our survey fall within the LoTSS DR2 sky coverage, of which 12 were detected.
4.2. RACS
The Rapid ASKAP Continuum Survey (RACS; McConnell et al. 2020; Hale et al. 2021) is the first large-area survey completed using the Australian Square Kilometer Array Pathfinder (ASKAP; Hotan et al. 2021). RACS covered the entire southern sky up to a declination +41° with a median field rms sensitivity of 250 μJy beam−1. RACS-low, as part of the RACS Data Release 1, was observed at a central frequency of 887.5 MHz with a resolution of 15''. 5 Fourteen of the 28 SPM galaxies in our survey fall within the RACS sky coverage, of which seven were detected.
4.3. FIRST
The Faint Images of the Radio Sky at Twenty Centimeters (FIRST; Helfand et al. 2015) survey was a VLA survey conducted at 1.4 GHz and observed the entire sky north of +10° and south of +65°, covering 10,575 deg2. The survey resolution is given at 5'' with a typical rms sensitivity of 150 μJy beam−1. Twenty-seven of the 28 SPM galaxies in our survey fall within the FIRST sky coverage, of which 14 were detected. We used the flux density and rms values listed for each source from the catalog of Helfand et al. (2015), except for 3σ sources, which were not included in this catalog.
4.4. NVSS
The NRAO VLA Sky Survey (NVSS; Condon et al. 1998) was a VLA survey conducted at 1.4 GHz and observed the entire sky north of −40°. The nominal resolution of the survey is 45'' with a typical rms sensitivity of 450 μJy beam−1. All of the 28 SPM galaxies in our survey were observed as part of the NVSS, of which 11 were detected. The coarse angular resolution of the NVSS provides better sensitivity to low-surface-brightness emission but is more susceptible to artificial spectral steepening and to source confusion. In our analyses, we used the NVSS flux density measurements as a test for kiloparsec-scale radio structures via comparison with the integrated FIRST flux density for each source. However, we preferentially used the FIRST catalog to extract the 1.4 GHz flux densities in Section 5.4, except for J1304+6520, which was not observed in FIRST.
4.5. VLASS
The VLA Sky Survey (VLASS; Lacy et al. 2020) is an ongoing VLA survey using the S-band receiver, covering the frequency range 2–4 GHz, which will cover the whole sky observable by the VLA (δ > −40°) over three observing epochs. Each observing epoch is designed to reach a nominal rms sensitivity of 120 μJy beam−1 with a resolution of 25. VLASS has currently completed two observing epochs, with raw and calibrated data sets and Quick Look images available for both Epochs 1 and 2. The flux density accuracy of Quick Look sources in the first campaign of the first epoch of VLASS (VLASS1.1) were affected by antenna pointing errors, giving systematically lower flux density measurements of 10% with a scatter of ±8% for flux densities below ≈1 Jy (see VLASS Memo 13 for more detail).
6
For this reason, we used only the campaigns from the second epoch of VLASS (VLASS2.1 and VLASS2.2) for the S-band flux density of sources of interest. As mentioned in Section 3, we observed six of the SPM galaxies in separate VLA observing campaigns at S band. We used these 3 GHz VLA observations for these sources to derive source parameters instead of any corresponding VLASS detections for them. The remaining 22 SPM galaxies have all been observed in the second VLASS campaign, of which eight were detected. To extract the flux density of the detected sources, we used the CASA task IMFIT to fit a two-dimensional Gaussian to the source in each Quick Look image.
4.6. Other Radio Surveys
There are a number of archival radio surveys across the radio frequency spectrum that we did not employ in our analysis. We searched all available radio catalogs in the NASA HEASARC Archive for coincident radio detections within a 1' radius of the optical host centroid defined by the SDSS (see Table 1 for these coordinates). 7 Aside from the continuum surveys already mentioned, no radio catalog available to the HEASARC had more than three detections within the defined search radius from each post-merger optical centroid, with WENSS (Rengelink et al. 1997) providing the highest number of detections. We did not include the WENSS sources because of low total source count and potential source confusion due to the resolution of the restoring beam. We separately searched for coincident radio emission in the TGSS (150 MHz; Intema et al. 2017) and VCSS (340 MHz; Clarke et al. 2016; Polisensky et al. 2016) catalogs, each with a 2' search radius. Because of the low sensitivity of these surveys, ≈5 mJy beam−1 and 3 mJy beam−1 at a 1σ threshold for TGSS and VCSS, respectively, no coincident radio emission was detected by either survey for each of our 28 post-merger galaxies.

Table 1. Spheroidal Post-merger Sample and BPT Classification
| Source | R.A. | Decl. | z | BPT |
|---|---|---|---|---|
| (1) | (2) | (3) | (4) | (5) |
| J0206−0017 | 31.567 | −0.291 | 0.043 | AGN |
| J0759+2750 | 119.952 | 27.839 | 0.067 | Composite |
| J0833+1523 | 128.289 | 15.398 | 0.076 | Quiescent |
| J0843+3549 | 130.937 | 35.828 | 0.054 | AGN |
| J0851+4050 | 132.978 | 40.836 | 0.029 | LINER |
| J0916+4542 | 139.212 | 45.700 | 0.026 | Composite |
| J1015+3914 | 153.992 | 39.243 | 0.063 | Star-forming |
| J1018+3613 | 154.640 | 36.224 | 0.054 | AGN |
| J1041+1105 | 160.266 | 11.096 | 0.053 | LINER |
| J1056+1245 | 164.196 | 12.762 | 0.092 | Quiescent |
| J1113+2714 | 168.419 | 27.241 | 0.037 | Star-forming |
| J1117+3757 | 169.385 | 37.963 | 0.096 | LINER |
| J1124+3005 | 171.142 | 30.095 | 0.055 | LINER |
| J1135+2913 | 173.781 | 29.891 | 0.046 | Star-forming |
| J1144+2309 | 176.183 | 23.162 | 0.048 | Quiescent |
| J1230+1146 | 187.554 | 11.770 | 0.089 | Quiescent |
| J1253+3944 | 193.458 | 39.738 | 0.092 | Quiescent |
| J1304+6520 | 196.060 | 65.346 | 0.083 | AGN |
| J1314+2607 | 198.656 | 26.123 | 0.074 | Quiescent |
| J1326+5653 | 201.726 | 56.889 | 0.090 | Quiescent |
| J1405+4001 | 211.414 | 40.032 | 0.084 | Quiescent |
| J1433+3444 | 218.327 | 34.735 | 0.034 | LINER |
| J1445+5134 | 221.438 | 51.581 | 0.030 | Composite |
| J1511+0417 | 227.771 | 4.294 | 0.042 | LINER |
| J1511+2309 | 227.964 | 23.151 | 0.052 | Quiescent |
| J1517+0409 | 229.454 | 4.162 | 0.037 | Quiescent |
| J1617+2512 | 244.426 | 25.206 | 0.031 | Composite |
| J1655+2639 | 253.790 | 26.663 | 0.035 | Quiescent |
Note. Column (1): source name. Column (2): J2000 right ascension. Column (3): J2000 declination. Column (4): spectroscopic redshift from the SDSS. Column (5): Baldwin–Phillips–Terlevich classification.
Download table as: ASCIITypeset image
5. Source Properties
Following the detection criterion of Section 4, 75% (12/16) of the sources with available LoTSS data were detected; 50% (7/14) with available RACS data were detected; 54% (15/28) with available 1.4 GHz data, from either FIRST or NVSS, were detected; 36% (8/22) with available VLASS data were detected, with a 100% detection rate for the remaining six with separate 3 GHz VLA observations; and 67% (18/28) were detected by our 10 GHz VLA observations.
5.1. Emission-line Activity
Emission-line diagnostics are a powerful tool to probe the dominant ionization mechanism in a galaxy. To examine the emission-line behavior of the 30 SPM galaxies, we have used the Oh–Sarzi–Schawinski–Yi (OSSY) catalog (Oh et al. 2011) to obtain the intrinsic fluxes of the Hβ, [O iii]λ5007, Hα, [N ii]λ6583, [S ii]λ6717, and [O i]λ6300 emission lines. Oh et al. (2011) determined these values by performing a spectral fitting routine to the SDSS Data Release 7 spectrum of each source. If the S/N for any of the Hβ, [O iii]λ5007, Hα, or [N ii]λ6583 lines was <3, we classified the galaxy as quiescent. For the remaining galaxies, we followed the standard Baldwin–Phillips–Terlevich (BPT) diagram analysis (Baldwin et al. 1981). For the [N ii]/Hα diagnostic, we used the demarcation of Kauffmann et al. (2003) to distinguish between pure star-forming (SF) and SF-AGN composite galaxies. Composite galaxies and AGNs are divided using the theoretical maximum starburst model from Kewley et al. (2001). AGNs are then subdivided between Seyferts and low-ionization nuclear emission-line regions (LINERs) by the division of Schawinski et al. (2007b). The best indication of Seyfert or LINER behavior is achieved by using the [O i]λ6300 emission line (Schawinski et al. 2007b). However, the [O i]λ6300 line is typically weaker than any of the other lines used, and we only employed this diagnostic if the [O i]λ6300 line was detected with a S/N ≥ 3. Otherwise, we employed the [S ii]λ6717 diagnostic to distinguish between Seyfert AGNs and LINERs. For these two diagnostics, we used the Seyfert–LINER demarcation lines of Kewley et al. (2001). If neither line was detected, we used the [N ii] diagnostic to distinguish between Seyferts and LINERs.
The results of our BPT analysis are presented in Figure 1, where each data point is colored by its u − r color. The emission-line classification of each SPM galaxy is listed in Table 1. It should be noted that for even the bluest of the SPM galaxies in the C12 sample, their overall u − r color is still predominantly red. This is expected, as C12 found that the u − r colors of this SPM sample is indicative of a recent star formation episode, e.g., bluer than an early-type control sample, but one that peaked prior to the merger coalescence, e.g., redder than a sample of ongoing mergers (see Figure 5 of C12).

Figure 1. BPT diagnostic diagrams for the emission-line galaxies in our sample of 28 spheroidal post-merger (SPM) galaxies derived from C12. Each point is colored by its u − r color, with the color bar indicating the range of values in the scale. Even for the most blue SPMs, the SPMs are still predominantly red in color. The dashed line in the [N ii]λ6583/Hα diagram (left panel) is the empirical SF line of Kauffmann et al. (2003) and the straight line that divides Seyferts and LINERs is from Schawinski et al. (2007b). Seyferts and LINERs are divided in the [S ii]λ6717/Hα (middle panel) and [O i]λ6300/Hα (right panel) diagrams from the line of Kewley et al. (2006). In all diagrams, the solid line is the theoretical maximum from the starburst models of Kewley et al. (2001). Galaxies that fall between the lines of Kauffmann et al. (2003) and Kewley et al. (2001) are SF-AGN composites, while those below Kauffmann et al. (2003) are purely SF.
Download figure:
Standard image High-resolution imageThe BPT diagnostic for J0206−0017 deserves special attention. The middle panel of Figure 1 shows only 16 of the 17 identified active galaxies. This is because the data point for J0206−0017 has log([S ii]λ6717/Hα) = −1.27. In comparison to the much larger sample of active SDSS galaxies used by Kewley et al. (2006), there are no galaxies which approach this value of J0206−0017. This is most likely attributable to the fact that J0206−0017 is a known changing-look AGN with asymmetric broad-line emission (Cohen et al. 1986; McElroy et al. 2016). The prescription used by OSSY to determine the line fluxes would not have accounted for the extremely broad nature of the Hα and Hβ lines for this source, and we would most likely need to perform our own spectral fitting routine to extract a reliable flux value for the narrow emission-line components to these broad lines. Because of this, we have classified J0206−0017 as a Seyfert AGN instead of as a SF galaxy as would be determined by its BPT diagnostics.
We also note that the spectra of J0908+1407, J1511+2309, and J1655+2639 all contain Hβ absorption. In all of these cases, the Hβ absorption appears to be of stellar origin. Through visual inspection, there does not appear to be a significant blueshift in the Hβ absorption, which would be representative of an AGN-related outflow (e.g., Williams et al. 2017). For any Hβ emission present in these sources, the S/N of the emission line was <3. Although the emission lines of [O iii]λ5007, Hα, and [N ii]λ6583 are all detected with a S/N ≥ 3 in these spectra, for consistency we classified them as quiescent because of the weak Hβ emission.
In total, we found that 43% (13/30) of the C12 SPM galaxies were classified as quiescent. The remaining ≈57% (17/30) were classified as either purely SF (10%; 3/30), SF-AGN composite (≈13%; 4/30), Seyfert AGN (≈13%; 4/30), or LINER (20%; 6/30) from their BPT diagnostics. In comparison to the emission-line diagnostics performed by C12, our analysis finds a higher percentage of quiescent galaxies (16% ± 6% to 43%), a lower percentage of Seyfert AGNs (42% ± 6% to 13%), and a similar percentage of LINERs (26% ± 6% to 20%) and SF galaxies (16% ± 6% to 10%). Direct comparison is somewhat ambiguous, though, since C12 did not use the SF-AGN composite classification for their BPT analysis. It is unclear where the composite systems we identified would fall in the analysis of C12. It is interesting, however, that we arrive at different conclusions for the number of quiescent galaxies considering both the OSSY catalog and C12 used the gandalf code (Sarzi et al. 2006) to perform emission-line fitting of the spectra. We would expect, then, that the S/N of the requisite emission lines would not change between the two analyses. Even if the three Hβ absorption spectra are considered as active galaxies by C12, this only marginally reduces the percentage of quiescent galaxies we have identified from 43% to 30%, which is still a factor of 2 greater than what was found by C12.
5.2. Radio Flux Densities and Luminosities
Flux density measurements were obtained either from survey catalog entries or from the CASA task IMFIT when reported values were not available. The integrated flux density measurements and their associated errors for each source are summarized in Table 2. For sources identified in the LoTSS, RACS, and FIRST/NVSS catalogs, the measurement error in Table 2 is the error quoted by each catalog summed in quadrature with a 5% uncertainty in the absolute flux scale. For VLASS and 3σ detections in any of the archival radio surveys, the error is the rms image noise and 5% uncertainty in the absolute flux scale. For sources detected by the 3 and 10 GHz VLA observations, the errors are the image rms and a 3% uncertainty in the absolute flux scale (Perley & Butler 2017).
Table 2. Integrated Flux Density Values
| Source | SLoTSS (mJy) | SRACS (mJy) | S1.4 GHz (mJy) | S3 GHz (mJy) | S10 GHz (mJy) |
|---|---|---|---|---|---|
| (1) | (2) | (3) | (4) | (5) | (6) |
| J0206−0017 | ⋯ | 5.38 ± 0.81 | 3.36 ± 0.18 | 1.91 ± 0.07 | 1.64 ± 0.06 |
| J0759+2750 | 11.3 ± 0.6 | 4.23 ± 0.52 | 3.45 ± 0.21 | 1.93 ± 0.15 | 0.786 ± 0.016 |
| J0833+1523 | ⋯ | <1.65 | <0.41 | <0.48 | <0.06 |
| J0843+3549 a | 29.7 ± 0.8 | ⋯ | 3.77 ± 0.17 | 2.79 ± 0.13 | 0.539 ± 0.017 |
| J0851+4050 | 1.0 ± 0.2 | ⋯ | <0.43 | <0.37 | 0.226 ± 0.015 |
| J0916+4542 | 2.6 ± 0.2 | ⋯ | 0.782 ± 0.13 | <0.33 | 0.11 ± 0.013 |
| J1015+3914 b | 11.5 ± 0.4 | ⋯ | 1.36 ± 0.19 | 1.13 ± 0.13 | 0.526 ± 0.024 |
| J1018+3613 | 23.4 ± 0.9 | ⋯ | 16.2 ± 0.8 | 8.75 ± 0.25 | 2.72 ± 0.08 |
| J1041+1105 | ⋯ | 3.3 ± 0.5 | <0.39 | <0.45 | 0.08 ± 0.012 |
| J1056+1245 | ⋯ | <1.2 | <0.41 | <0.47 | <0.04 |
| J1113+2714 | ⋯ | 1.08 ± 0.30 | 1.32 ± 0.14 | <0.35 | 0.063 ± 0.012 |
| J1117+3757 | 2.0 ± 0.2 | ⋯ | <0.43 | <0.33 | <0.04 |
| J1124+3005 | 0.9 ± 0.2 | ⋯ | <0.44 | <0.33 | <0.03 |
| J1135+2913 | 15.2 ± 0.6 | ⋯ | 3.38 ± 0.22 | 2.89 ± 0.14 | 0.355 ± 0.013 |
| J1144+2309 | ⋯ | <1.38 | <0.45 | <0.34 | <0.04 |
| J1230+1146 | ⋯ | <16 | <0.65 | <0.65 | <0.05 |
| J1253+3944 | <0.30 | ⋯ | <0.39 | <0.41 | <0.04 |
| J1304+6520 | 12.3 ± 0.5 | ⋯ | 2.41 ± 0.24 | 2.95 ± 0.22 | 0.99 ± 0.29 |
| J1314+2607 | <0.30 | <0.78 | <0.41 | <0.40 | <0.04 |
| J1326+5653 | <0.30 | ⋯ | <0.46 | <0.56 | <0.04 |
| J1405+4001 | <0.30 | ⋯ | <0.41 | <0.50 | <0.04 |
| J1433+3444 | 15.6 ± 0.7 | ⋯ | 2.69 ± 0.19 | 2.02 ± 0.16 | 1.15 ± 0.036 |
| J1445+5134 | 28.2 ± 1.0 | ⋯ | 11.9 ± 0.58 | 6.06 ± 0.14 | 1.05 ± 0.049 |
| J1511+0417 a | ⋯ | <2.3 | 1.55 ± 0.17 | 1.068 ± 0.032 | 1.342 ± 0.039 |
| J1511+2309 | ⋯ | 11.8 ± 1.7 | 1.32 ± 0.19 | 0.495 ± 0.031 | 0.249 ± 0.017 |
| J1517+0409 | ⋯ | <1.8 | <0.45 | 0.39 ± 0.12 | 0.12 ± 0.013 |
| J1617+2512 | ⋯ | 1.47 ± 0.46 | 1.41 ± 0.15 | 1.06 ± 0.13 | 0.22 ± 0.012 |
| J1655+2639 | ⋯ | 7.8 ± 0.59 | 4.70 ± 0.23 | 2.50 ± 0.07 | 0.77 ± 0.02 |
Notes. Column (1): source name. Column (2): LoTSS (144 MHz) flux density and error (Shimwell et al. 2022); upper limits indicate a 3σ nondetection, whereas no entry means the source was not included in the survey field. Column (3): RACS (888 MHz) flux density and error (McConnell et al. 2020; Hale et al. 2021). Column (4): 1.4 GHz flux density and error, reported from either FIRST (27/28; Helfand et al. 2015) or NVSS (1/28; Condon et al. 1998). Column (5): 3 GHz flux density and error, reported from either VLASS (22/28; Lacy et al. 2020) or archival VLA observations (6/28). Column (6): 10 GHz flux density and error, reported from our VLA observations.
a These flux density measurements are reported for the dominant component when the source is resolved into a multicomponent morphology. b The flux density at 10 GHz was found after applying a UV taper to the image plane.Download table as: ASCIITypeset image
The observed radio flux densities span 0.90–30 mJy, with a median of 12 mJy, for the 12 LoTSS detections; 1.1–12 mJy, with a median of 4.2 mJy, for the seven RACS detections; 0.78–16 mJy, with a median of 2.7 mJy, for the 15 FIRST/NVSS detections; 0.39–8.8 mJy, with a median of 2.0 mJy, for the 14 VLASS/3 GHz VLA detections; and 0.06–2.7 mJy, with a median of 0.50 mJy, for the 18 with a 10 GHz VLA detection.
Each SPM galaxy has an associated redshift measurement from the SDSS. We used this and the flux density measurement to calculate a luminosity at each observing frequency for each of the detected radio sources. We show the luminosity distributions for the ν < 1 GHz (LoTSS, RACS) and ν > 1 GHz (FIRST/NVSS, VLASS, VLA) surveys in Figure 2. After calculating the luminosities for each source, we compared these to the standard jetted radio AGN demarcation luminosity ν Lν ≈ 1032 W. A luminosity value above this demarcation indicates radio emission almost certainly associated with AGN activity (Condon et al. 2002; Kimball et al. 2011). We find that, for at least 1 GHz frequency, the radio luminosity of J1018+3613 and J1304+6520 is consistent with a jetted radio AGN progenitor. The remaining radio sources are all low-luminosity objects and the dominant progenitor of their radio emission is ambiguous when considering only their luminosity characteristics.
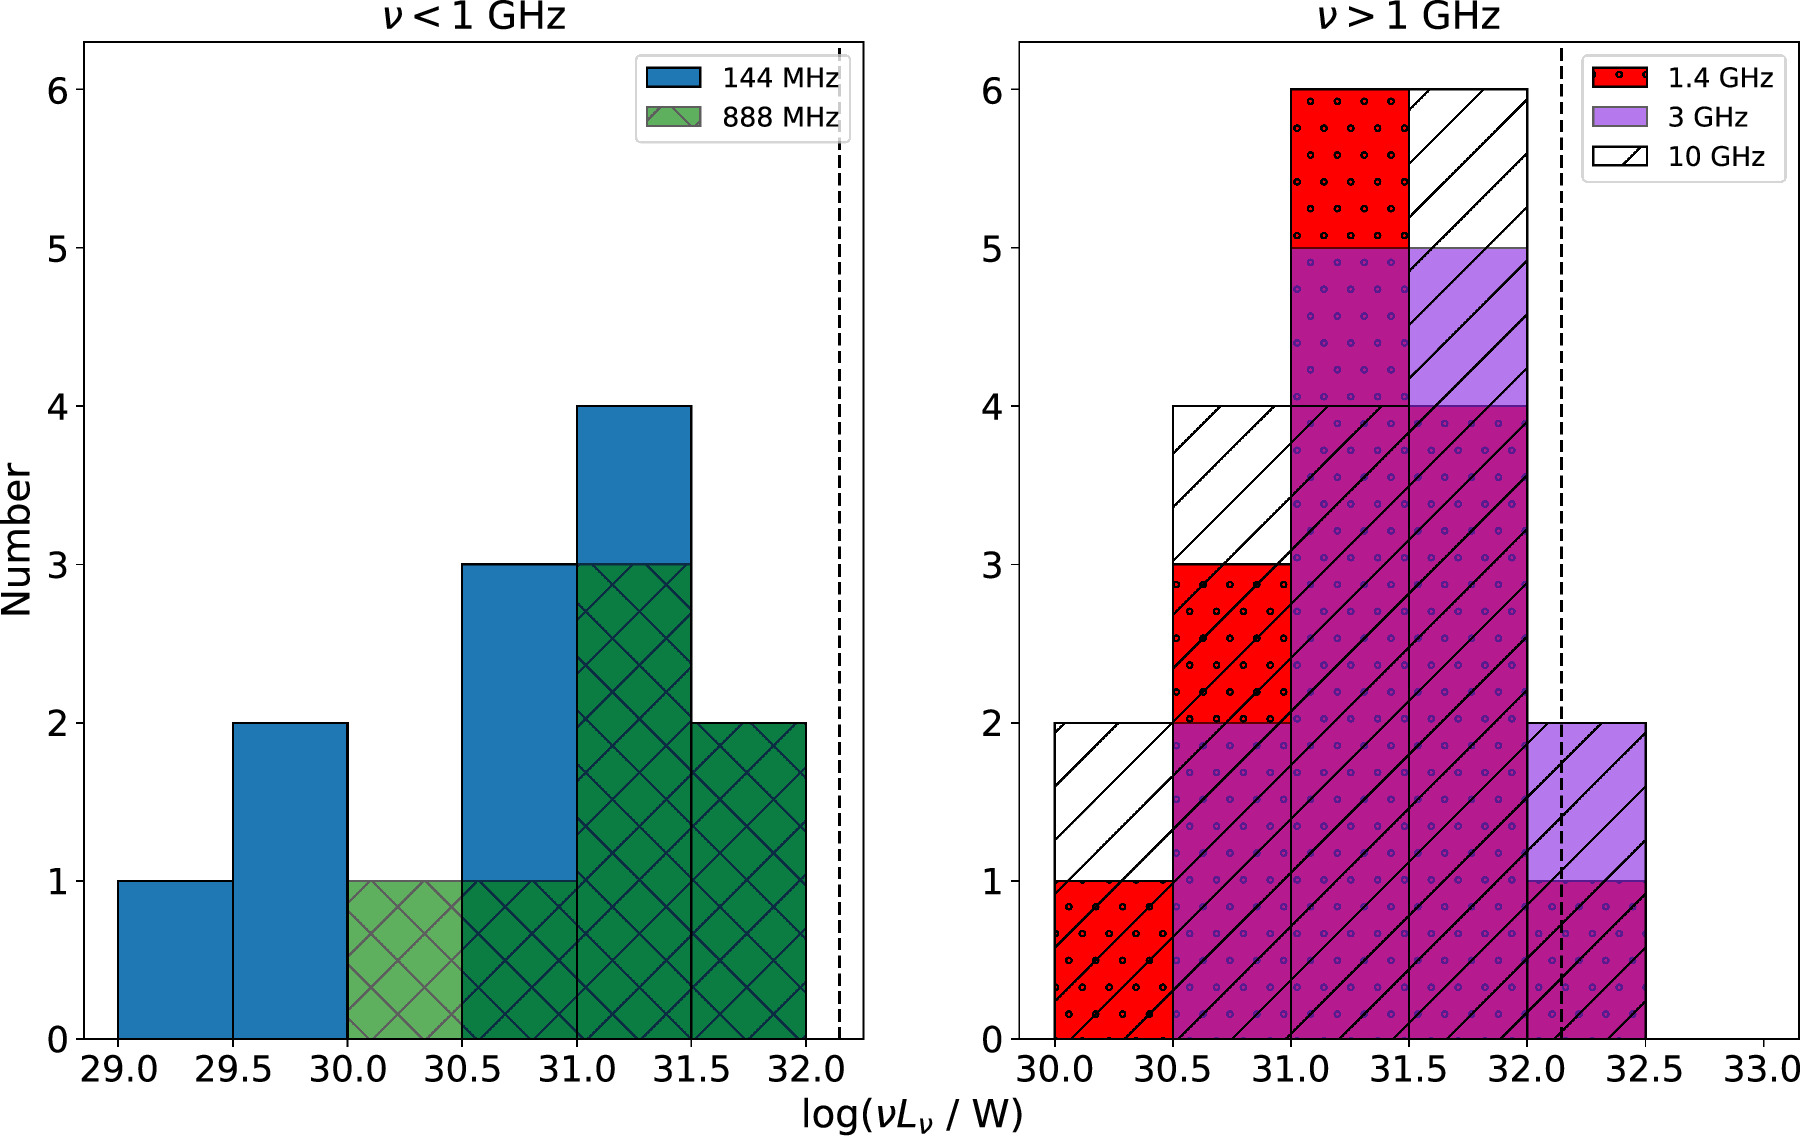
Figure 2. Left: luminosity (ν Lν ) distribution of the radio sources associated with each SPM galaxy from the radio surveys observed in the MHz regime: LoTSS (solid blue) and RACS (hatched green). Some of the SPM galaxies were not observed in each survey. The dashed vertical line represents the demarcation between jetted and low-luminosity radio sources at 1.4 GHz, or ν Lν = 1.4 × 1032 W. Right: same as left but for radio surveys observed in the GHz regime: FIRST or NVSS (dotted red), VLASS or 3 GHz VLA (solid purple), and 10 GHz VLA (hatched).
Download figure:
Standard image High-resolution image5.3. Radio Morphology
We describe the bulk radio morphology properties of the detected sources in each of the radio surveys. Each individual source and its intensity maps are discussed and presented in the Appendix.
For each source, we categorize the morphology into one of the following classifications, following the criteria of Owen (2018) and Patil et al. (2020):
- 1.Unresolved. The peak-to-integrated flux density ratio is unity within 1σ uncertainty and the source is a single Gaussian component that does not exhibit any flux beyond the synthesized beam: 0/12 sources are unresolved by LoTSS; 3/7 sources by RACS; 5/15 sources by FIRST/NVSS; 6/14 sources by VLASS or 3 GHz VLA; and 6/18 sources by our 10 GHz VLA observations.
- 2.Marginally resolved. The peak-to-integrated flux density ratio is unity within 1σ uncertainty and the source is marginally extended along one axis of the synthesized beam: 1/12 sources are marginally resolved by LoTSS; 2/7 sources by RACS; 7/15 sources by FIRST/NVSS; 1/14 sources by VLASS or 3 GHz VLA; and 3/18 sources by our 10 GHz VLA observations.
- 3.Resolved. The peak-to-integrated flux density ratio of the source is significantly less than unity, and the deconvolved major and minor axes have nonzero size: 11/12 sources are resolved by LoTSS; 2/7 sources by RACS; 2/15 sources by FIRST/NVSS; 6/14 sources by VLASS or 3 GHz VLA; and 7/18 sources by our 10 GHz VLA observations.
- 4.Multicomponent. The intensity map of the radio source shows two or more distinct radio components common to one central engine: 0/12 sources are multicomponent in LoTSS; 0/7 in RACS; 1/15 in FIRST/NVSS; 1/14 in VLASS or 3 GHz VLA; and 2/18 in our 10 GHz VLA observations.
Visual inspection of the FIRST intensity map of J1511+2309 (Figure A15) shows two distinct radio components separated by ∼10'', or 10 kpc at the redshift of the source. The central component is compact and spatially coincident with the optical nucleus of the host galaxy. The second component is extended in morphology and has no optical counterpart. This morphology is similar to what is observed in classic FRI (Fanaroff & Riley 1974) radio galaxies, with the caveat that J1511+2309 does not show a two-sided lobe morphology. To test if the northwest component is a radio lobe associated with the compact component, we first determined the two-point spectral index of the compact component using the 1.4 GHz and 3 GHz flux density estimates (), using an identical prescription for the determination of described in Section 5.4. With , we then estimated and removed the compact component's contribution to the total 888 MHz flux density. The FIRST catalog provided the 1.4 GHz flux density for the lobe component, and we determined a spectral index using the core-subtracted 888 MHz flux density and this 1.4 GHz measurement. We find αlobe = −1.97 ± 0.41. Although resolution effects are certainly biasing this spectral index measurement toward steeper values, it is clear that such a steep-spectrum source is consistent with the expectations of an FRI radio lobe, and the extended radio component identified in FIRST is associated with the compact radio component cospatial with the post-merger host galaxy, classifying J1511+2309 as multicomponent at 1.4 GHz.


Similarly, the 144 MHz LoTSS map of J0843+3549 shows two distinct radio components separated by 273. The second radio source, observed to the southwest of the primary source, is associated with the galaxy cluster GMBCG J130.93151+35.82210 (Hao et al. 2010) at a redshift of z = 0.475 (Rozo et al. 2015). These two sources are clearly unrelated and do not share a common origin.
Figure 3 shows the logarithm of the peak-to-integrated flux density ratios for each of the detected sources. It is clear that at the lowest frequency, 144 MHz, each of the radio sources has an extended emission component. For most of these sources, this extended emission is diffuse and nonaxisymmetric, meaning it is unlikely from an AGN. Each of the LoTSS sources, however, still displays an unresolved component that is spatially coincident with the optical center of the host galaxy. J1433+3444 is the only source with collimated emission. We discuss this in Appendix A.12. For the peak-to-integrated flux density ratio of this source, we determined the total integrated flux density of the unresolved, nuclear emission plus the diffuse component by applying a mask to the region of interest in the intensity map within the CASA task VIEWER. However, the 144 MHz flux density reported in Table 2 and used in Section 5.4 is only that of the unresolved emission. We did this to mitigate the effects of artificial steepening of the radio spectrum of the nuclear emission, which is the main emission region of interest for our study. For the seven sources with a detection by RACS, we find a mix of unresolved, resolved, and marginally resolved sources.

Figure 3. Left: distribution of peak-to-integrated flux density ratios of the 10 GHz-detected SPM galaxies in the LoTSS (solid blue) and RACS (hatched green). Some of the SPM galaxies were not observed in each survey. More negative values indicate resolved structure of the radio source. Right: same as left but for FIRST or NVSS (dotted red), VLASS or 3 GHZ VLA (solid purple), and 10 GHz VLA (hatched).
Download figure:
Standard image High-resolution imageAt 1.4 GHz, the majority of sources do not show evidence for kiloparsec-scale structure; all display a compact component spatially coincident with the optical nucleus of the host galaxy. This shows that compact, nuclear emission is prevalent in the radio-detected SPM galaxies. Indeed, this is supported by comparison of the NVSS and FIRST flux density values for the 10 radio sources with a detection in both surveys. Of these 10, the ratio of NVSS-to-FIRST integrated flux densities is unity within 3σ for seven sources, showing that FIRST does not resolve out low-surface-brightness emission at larger angular scales. Of the remaining three, NVSS is sensitive to the lobe emission identified at 144 MHz for J1433+3444 (LoTSS panel of Figure A12), and blends the compact and lobe components of J1511+2309 (FIRST panel of Figure A15). We discuss the remaining source, J1511+0417, in Section 5.4.
Higher-resolution observations at 3 GHz reveal that extended emission is indeed prevalent in the majority of sources. Likewise, our 10 GHz observations further reveal extended emission of these nuclear radio sources. With the high resolution of our observations, many of the formerly unresolved sources at lower frequencies now show a diffuse, nonaxisymmetric component to the nuclear radio source (J0759+2750, J1015+3914, J1135+2953, J1304+6520, and J1617+2512). These high-resolution observations also reveal the multicomponent nature of the radio emission in J0843+3549 and J1511+0417.
5.4. Radio Spectra
The radio spectrum is a useful tool for interpreting the underlying physical characteristics of the radio source, including the dominant production mechanism of the observed emission. For AGNs, the radio emission is dominated by synchrotron emission from a distribution of relativistic electrons, creating a distinctive nonthermal power-law spectrum. For older jetted and lobe structures, the highest-energy electrons in the distribution will radiate away the fastest, causing a break in the power law at higher frequencies and creating a steep radio spectrum with a power-law slope α < −0.5. Radio cores, which are associated with the region of emission closest to the active SMBH itself, are actively injected with fresh high-energy electrons, creating a flat spectrum with a power-law slope α > −0.5. For H ii regions, thermal emission is dominant at rest-frame frequencies of ν > 10 GHz, and is characterized by a power-law slope α ≈ −0.1. At ν < 10 GHz, the nonthermal emission from supernova remnants (SNRs) dominates, with varying power-law slopes. Both mechanisms of emission can be self-absorbed at low frequency, causing a characteristic spectral turnover and inverted slope α > 0. Identifying and quantifying the power-law slope α, as well as the curvature and peak frequency, if present, can greatly aid in the interpretation of the radio source.
To explore this parameter space, we constructed a radio spectrum using the multifrequency flux density measurements we have tabulated for each of the 18 radio sources detected with our 10 GHz observations. We have chosen not to include J1117+3757 and J1124+3005, since these two SPMs were only detected by LoTSS. Twelve of these 18 radio sources were observed and detected in four or more of the radio surveys we have used. We considered these 12 to be well-sampled radio spectra for our analysis.
To constrain the overall shape of the radio spectrum for these 12 well-sampled radio sources, we have performed a two-fold fitting procedure. First, the spectrum is fit by a simple power law of the form

where Sν is the flux density in mJy, A is the amplitude in mJy, ν is the observing frequency in GHz, and α is the spectral index value. The second fit describes a parabola in log space and accounts for curvature in the overall shape of the radio spectrum as

where Sν , A, ν, and α are identical to Equation (1), and q gives the spectral curvature. For cases of significant curvature, e.g., ∣q∣ ≥ 0.2 (Duffy & Blundell 2012), α and q lead to a peak frequency νpeak of

Here, q is strictly phenomenological. Physically motivated synchrotron self-absorption or free–free absorption models, or models with multiple electron populations, would require more free parameters, e.g., more flux density measurements at distinct frequencies, than were available for this analysis (Tingay et al. 2015). However, q is still an important constraint to describe the overall shape of the radio spectrum and can hint at the underlying physical mechanism of the radio emission (Callingham et al. 2017; Nyland et al. 2020; Patil et al. 2022).
For the remaining six sources without well-sampled spectra, the maximum number of detections for a single source across all the surveys used is three. We could not perform the curved power-law fit to these spectra given the paucity of data. In addition, the spectral index values determined by our two-fold fitting procedure are often difficult to interpret for such a wide frequency range, spanning approximately 2 decades in frequency for some sources. To obtain a representative spectral index value, we performed a linear fit to the 3 and 10 GHz flux density values for each of the 18 10 GHz-detected radio sources. For those sources without a 3 GHz detection, this estimate provides a lower limit to the actual spectral index value. We chose to use the 3 and 10 GHz flux density values because our ultimate goal is to characterize the nuclear radio emission detected by our high-resolution VLA observations. These observing frequencies have the highest angular resolution among the surveys used for our analysis, giving us the best approximation to the true spectral index value of the nuclear radio emission.
The two-point spectral index is given by


with an associated error of

where S3, S10, σ3, and σ10 are the 3 GHz and 10 GHz flux density measurements and their associated error in mJy, respectively.
Six radio sources are resolved at 3 GHz, likely biasing their measurement due to artificial spectral steepening when using their integrated 3 GHz flux density. To mitigate this, we determined using their peak flux density at 3 GHz. For any 3 GHz peak flux density measurement reported by VLASS, we accounted for the known ≈8% reduction in peak flux density and added in an additional 10% relative error due to residual phase errors in VLASS Epoch 2 Quick Look images. We note that, although the spectral index measurements are distinct between using the peak and integrated 3 GHz flux density values, the overall interpretations we derive using either remain consistent regardless of the method.


Figures 4 and 5 show each radio spectrum and the results of our fitting analyses for the 18 10 GHz-detected radio sources. Table 3 lists the reduced χ2 values of the power-law and curved power-law fits for the 12 well-sampled radio spectra. For each of these, the spectral curvature parameter q is provided for those spectra that are better fit by a curved power law than a simple power law (. We also list the peak frequency νpeak for the three sources that have q ≤ −0.2. Table 3 also lists the two-point spectral index value , or its lower limit, for all 18 sources.


Figure 4. Broadband radio spectrum for each of the 12 well-sampled radio sources detected by our 10 GHz observations. Radio surveys used are labeled by different markers and colors, with the key in the upper right of each spectrum. 3σ errors are plotted for each flux density measurement. The best-fit power law and curved power law are plotted as the dashed and solid black lines, respectively.
Download figure:
Standard image High-resolution image
Figure 5. Broadband radio spectrum for each of the six radio sources detected by our 10 GHz VLA observations that were a nondetection by one or more of the radio surveys used. Radio surveys are labeled by different markers and colors, with the key in the upper right of each spectrum. 3σ errors are plotted for each flux density measurement. Unfilled markers indicate a 3σ nondetection in that survey. The two-point spectral index or its limit is plotted as the dotted–dashed black line.

Download figure:
Standard image High-resolution imageTable 3. Radio Spectral Fitting Parameters
| Source | q | νpeak | |||
|---|---|---|---|---|---|
| (MHz) | |||||
| (1) | (2) | (3) | (4) | (5) | (6) |
| J0206−0017 | 76.0 | 0.23 | −0.13 ± 0.04 | 0.29 ± 0.01 | ⋯ |
| J0759+2750 | 113 | 1.52 | −0.75 ± 0.07 | −0.04 ± 0.02 | ⋯ |
| J0843+3549 a | 95.0 | 531 | −0.60 ± 0.13 | ⋯ | ⋯ |
| J0851+4050 | ⋯ | ⋯ | >−0.41 | ⋯ | ⋯ |
| J0916+4542 | ⋯ | ⋯ | >−0.91 | ⋯ | ⋯ |
| J1015+3914 | 7164 | 5673 | −0.64 ± 0.10 | 0.10 ± 0.07 | ⋯ |
| J1018+3613 | 1048 | 21.8 | −0.97 ± 0.03 | −0.19 ± 0.02 | 290 |
| J1041+1105 | ⋯ | ⋯ | >−1.43 | ⋯ | ⋯ |
| J1113+2714 | ⋯ | ⋯ | >−1.42 | ⋯ | ⋯ |
| J1135+2913 a | 1348 | 1538 | −1.14 ± 0.12 | ⋯ | ⋯ |
| J1304+6520 | 13.9 | 186 | −0.91 ± 0.07 | ⋯ | ⋯ |
| J1433+3444 a | 64.7 | 4.27 | −0.22 ± 0.12 | 0.08 ± 0.02 | ⋯ |
| J1445+5134 a | 1458 | 19.3 | −1.19 ± 0.05 | −0.18 ± 0.02 | 155 |
| J1511+0417 | ⋯ | ⋯ | 0.19 ± 0.03 | ⋯ | ⋯ |
| J1511+2309 | 217 | 114 | −0.57 ± 0.08 | 1.61 ± 0.36 | ⋯ |
| J1517+0409 | ⋯ | ⋯ | −0.99 ± 0.27 | ⋯ | ⋯ |
| J1617+2512 a | 216 | 4.92 | −0.84 ± 0.21 | −0.37 ± 0.08 | 1114 |
| J1655+2639 a | 5.80 | 19.5 | −0.86 ± 0.09 | ⋯ | ⋯ |


Notes. Column (1): source name. Column (2): reduced χ2 value for a power-law fit to the radio spectrum; reported for sources with four or more survey detections. Column (3): reduced χ2 value for a curved power-law fit to the radio spectrum; reported for sources with four or more survey detections. Column (4): spectral index value, and its error, for the optically thin emission, or its lower limit; this was estimated by using the 3 and 10 GHz integrated flux density values, or the upper limit on the 3 GHz flux for nondetections at this frequency. Column (5): spectral curvature parameter determined by the curved power-law fit; reported if . Column (6): peak frequency of the radio spectrum; reported if and q < 0.
a determined using 3 GHz peak flux density due to resolved structure at this frequency.


Download table as: ASCIITypeset image
We find that five of the 12 well-sampled radio spectra show evidence of significant curvature: J0206−0017, J1018+3613, J1445+5134, J1511+2309, and J1617+2512. Of these, J1018+3613, J1445+5134, and J1617+2512 are all peaked spectrum objects, while J0206−0017 and J1511+2309 have q > 0.2, indicative of an inverted spectrum. Visual inspection of the radio spectrum for these two sources shows that their actual nature is most likely not inverted. Instead, it is probable that larger-scale emission components with steeper spectra are being resolved out by the higher-frequency, higher-resolution observations, leaving only the most compact features as the sole contributor to the recovered flux density and causing the spectrum to flatten. Indeed, the flat-spectrum nature of J0206−0017 was confirmed by Walsh et al. (2023). We expect that higher-frequency observations of J1511+2309 would confirm the presence of a flat-spectrum object in this source. We did not find evidence of significant curvature in the remaining seven well-sampled radio spectra.
The two-point spectral index values span a range . The majority of sources (11/14) have a steep spectral index, e.g., α < −0.5; J0206−0017 and J1433+3444 have a flat spectral index, e.g., −0.5 ≤ α ≤ 0; and J1511+0417 has an inverted spectral index value of . The spectrum of J1511+0417 is likely truly inverted, unlike the spectra of J0206−0017 and J1511+2309, though better sampling of the radio spectrum is needed to confirm this. Of those sources with lower limits on , J0851+4050 likely has a flat spectral index given that . The limits for the remaining three radio sources leave their radio spectral class ambiguous.


The reduced χ2 values for the best-fit simple and curved power laws to the radio spectrum of J0843+3549, J1015+3914, J1135+2953, and J1304+6520 are statistically poor. This can be interpreted in two ways. First, deviations from the best-fit lines may be explained by intrinsic variability of the radio source. The observations at 144 MHz (LoTSS), 888 MHz (RACS), 3 GHz (VLASS/VLA), and 10 GHz (VLA) are quasi-contemporaneous; at most, the observations were taken within 5 yr of one another. Yet, the 1.4 GHz observations, by either FIRST or NVSS, were conducted well over a decade ago (at least) at the time of this analysis. If the source underwent significant variability over a years-long timescale prior to its most recent observation at 1.4 GHz, all of the flux density measurements at frequencies besides 1.4 GHz would reflect this. It is possible, then, that these sources have naturally varied over this intervening time span and are no longer well fit to the quasi-contemporaneous data points of the other surveys. The corresponding variability amplitudes at 1.4 GHz, assuming a power-law fit to the spectrum without the 1.4 GHz flux density properly describes the spectral shape, range from 12% to 61%. These amplitudes are certainly plausible, given that some sources have been found to reach variability amplitudes higher than 2400% at this observing frequency (Nyland et al. 2020).
However, it is evident that the 10 GHz flux density measurement provides the most significant deviation from the best-fit behavior in, for example, the radio spectrum of J1135+2953. In this case, flux variability is disfavored and a separate physical model must be employed to explain the poor best-fit power-law models. Additionally, matched-frequency flux density comparison at different angular resolution and observing epochs, e.g., FIRST and NVSS, and VLASS and VLA 3 GHz, provides an independent analysis to probe for flux density variations over these separate epochs. However, except for J1511+0417, an intrinsic source variability model can be ruled out for these 10 sources (see the 1.4 GHz discussion presented in Section 5.3). J1511+0417 is unresolved in both of its FIRST and NVSS intensity maps, but has a flux density ratio SNVSS/SFIRST of 2.39 ± 0.42. This implies that either low-surface-brightness emission is resolved out by FIRST or the radio source has intrinsically varied. At 3 GHz, this ratio is SVLASS/S3 GHz = 1.17 ± 0.24, after summing the integrated flux for both components in the VLA map. Then, it is likely that some low-surface-brightness emission is resolved out by FIRST, though it should be noted that the 3 GHz observations were taken quasi-contemporaneously and may not truly reflect statistically significant variability as a result. Interpretation of these results to the entire 18 source sample disfavors an intrinsic variability model, but this cannot be ruled out from our data alone.
An alternative model is that the flux densities at lower frequencies, particularly at 144 MHz, are representative of a separate synchrotron-emitting electron population. For example, LoTSS sources in the local Universe will be dominated by diffuse emission associated with star formation processes. This diffuse emission will be resolved out when considering higher-frequency and higher-spatial-resolution observations,. If there is a second, distinct population of electrons producing radio emission that is more compact and hosted by the same SPM, this will become apparent by a break in the broadband radio spectrum. Essentially, the two electron populations, both of which are located within the same host galaxy, are confused with each other at low frequency, and only the high-frequency observations we have used are truly representative of the compact, nuclear source. Follow-up observations at high angular resolution with better frequency sampling are required to distinguish between the two methods we have outlined that may produce this observed break in the radio spectrum. The nature of these sources is further discussed in Section 6.
6. Origin of Radio Emission
In this section, we assess the origin of the radio emission in our SPM sample. Our analysis will make use of mid-IR fluxes available from the AllWISE source catalog (Wright et al. 2019) to perform a dust correction to the far-UV (FUV) flux for each SPM, for which we wish to calculate the SFR. In this paradigm, active star formation heats dust grains in the surrounding interstellar medium (ISM) that reradiate this energy as thermal emission in the mid-IR. However, it is possible for an AGN to also assume this heat engine role, and this will introduce systematic effects into our calculation of the SFR using the FUV fluxes. As such, we first identify if any of our sources are AGNs by a mid-IR selection criterion. To do this, we utilize a Wide-field Infrared Survey Explorer (WISE) color–color diagram to search for mid-IR AGNs using the selection criterion of Jarrett et al. (2011) for each of the 18 10 GHz-detected radio sources. These results are shown in Figure 6. We find that J0843+3549 and J0206−0017 are within the mid-IR AGN box of Jarrett et al. (2011), and J1018+3613 is consistent with a mid-IR AGN within errors. The remaining 15 sources are well outside of the AGN region and occupy the region of SF galaxies, e.g., spiral galaxies, luminous infrared galaxies (LIRGS), and starburst/ULIRGS (Wright et al. 2010). J0206−0017 (Osterbrock 1981; Cohen et al. 1986; McElroy et al. 2016; Walsh et al. 2023), J0843+3549 (Véron-Cetty & Véron 2001; Stern & Laor 2012; Koss et al. 2018), and J1018+3613 (Stern & Laor 2012; G. Walsh et al. 2024, in preparation) are all known AGNs, in addition to being identified as Seyfert AGNs via their emission-line ratios as presented in Section 5.1. To mitigate the impact of potential systematics introduced by the mid-IR AGNs to our SFR calculation, we conclude that the radio emission in each of these sources is associated with the AGN and remove them from the analyses described in this section. For each of the remaining 15 10 GHz-detected radio sources, we consider the following origin scenarios for their radio emission: thermal emission from SF regions, synchrotron emission from an individual radio supernova (RSN) or a population of SNRs, or an AGN.

Figure 6. WISE color–color diagram for the 18 10 GHz-detected SPM galaxies in our sample. The dashed black lines define the region of mid-IR AGNs taken from the selection criterion of Jarrett et al. (2011). Two of our sources, J0206−0017 and J0843+3549, are selected as mid-IR AGNs, while a third, J1018+3613, falls in this region within 1σ error. Each of these has multiwavelength evidence for an AGN. We conclude that their radio emission is associated with the AGN, and remove these sources from further analyses to avoid possible introduction of systematics by the AGN to the SFR calculation of each host SPM.
Download figure:
Standard image High-resolution image6.1. Radio Excess
We begin by searching for excess radio emission in each of the remaining 15 SPM radio sources. To do this, we predict what the SFR for each of the SPMs would be from their 1.4 GHz luminosity and compare this radio-predicted SFR to that calculated from the FUV emission of the host galaxy. Sources that have an overprediction of the SFR from their radio luminosity are called radio excess. These radio-excess sources cannot be explained from SF processes alone, while those that do not show radio excess can be, though are not necessarily.
We first predict the radio-based SFR using the 1.4 GHz luminosity. To do this, we use Equation (17) of Murphy et al. (2011):

This SFR is based on the far-IR (FIR)–radio correlation, which relates the galactic FIR properties to the galactic radio continuum properties. Murphy et al. (2011) note that the expected contribution to the total radio emission from nonthermal processes is negligible for some cases in which the emission is cospatial with an active H ii region. Condon & Yin (1990) argue that this is the case only for small H ii regions, for which stars with M > 8 M⊙ can escape before exceeding their lifetime of <3 × 10⁷ yr. For our sources that are identified as SF or SF-AGN composite galaxies via their optical emission-line ratios, the SDSS spectroscopic fiber has a diameter of 3''. We only know that within the galactic region covered by the spectroscopic fiber, an active H ii region is, at least partially for composite galaxies, contributing to the ionization. The area covered by the SDSS fiber is much larger than the synthesized beamwidth of our 10 GHz VLA observations (∼0.2''). Because none of our sources show features comparable in angular size to the SDSS fiber, for the consistency of the analysis we continued under the assumption that the H ii region is large enough such that there could be significant nonthermal radio emission spatially coincident with it.
To estimate the radio-based SFR, we use the 1.4 GHz luminosity values derived from the FIRST, or NVSS for J1304+6520, catalog entry for each source. We do this instead of extrapolating to the 1.4 GHz luminosity using because, as mentioned in Section 5.4, some sources exhibit clear breaks from their best-fit power law at 1.4 GHz, are likely affected by artificial spectral steepening, and the synthesized beams of FIRST and NVSS, 5'' and 45'', respectively, are better matched to galaxy-scale properties than the synthesized beam of our 10 GHz observations. It is important to most accurately trace the galaxy-scale radio emission because the FIR-radio correlation has been shown to deviate from a linear correlation for regions of radio emission with low thermal fractions (Hughes et al. 2006). At 1.4 GHz, the expected thermal contribution to the total radio emission for any radio source is approximately 5%–10% (Condon 1992; Murphy 2013). This is true even for starburst systems, for which Murphy (2013) found a thermal fraction of 5% in a sample of 31 local starburst galaxies. We assume, then, that the radio sources we have detected are not extraordinary in this regard, and have low thermal fractions at 1.4 GHz. However, the spatial scale range for which Hughes et al. (2006) found the FIR-radio correlation to deviate from a linear correlation is from 50 to 250 pc for their low-thermal-fraction radio sources. At 5'' resolution, the smallest spatial scale probed for our 18 source sample is approximately 3 kpc, or an order of magnitude larger than what was found by Hughes et al. (2006). Because of this, we do not expect any deviations from the standard FIR-radio correlation using the 1.4 GHz luminosity for our sources.

We now calculate the host-galaxy SFRs for 13 SPMs that had FUV measurements available from the Galaxy Evolution Explorer (GALEX; STScI 2013). The remaining two did not have GALEX measurements available, and we describe the calculation of their SFRs later in this section. We first correct the FUV luminosity for dust absorption by using the 25 μm WISE luminosity for each source, following Hao et al. (2011):

where all luminosity values are in units of erg per second. Here, we have used the available WISE 22 μm flux density as a proxy for the 25 μm luminosity, since the flux density ratio between these two values is expected to be unity for early-type galaxies (Jarrett et al. 2013). After calculating the WISE-corrected FUV luminosity, we find the host-galaxy SFR following Table 1 of Kennicutt & Evans (2012) for the FUV band:

Using this method, the 1σ uncertainty on the SFR is 0.13 dex (Hao et al. 2011). For the two SPM detections without available GALEX FUV measurements, J1304+6520 and J1511+2309, we use the Hα luminosity to calculate the host-galaxy SFR. Kennicutt et al. (2009) provide a dust-attenuated correction to the Hα luminosity using the 25 μm luminosity:

As before, all luminosity values are in erg per second. For L(Hα)obs, we use the values provided by the OSSY catalog (Oh et al. 2011) for each of the two optical spectra. We again follow Table 1 of Kennicutt & Evans (2012) to calculate the host-galaxy SFR using the dust-corrected Hα luminosity:

The 1σ uncertainty for the Hα method is 0.4 dex (Kennicutt et al. 2009).
The radio-based SFR is plotted against the galaxy-based SFR for each of our 10 GHz-detected SPM sources in Figure 7. The host-galaxy SFRs are in the range 0.2 M⊙ yr−1 ≤ SFR ≤ 17 M⊙ yr−1. We find four radio sources that do not exhibit excess radio emission, indicating that their radio emission could be explained by star formation processes alone. These are J1015+3914, J1041+1105, J1445+5134, and J1617+2512. Seven sources have excess radio emission above a factor of 3σ from what is expected by star formation processes, strongly supporting an AGN progenitor. These are J0759+2750, J1113+2714, J1135+2913, J1304+6520, J1433+3444, J1511+0417, and J1655+2639. Four of the remaining radio detections (J0851+4050, J0916+4542, J1511+2309, and J1517+0409) have low-significance (<3σ) evidence for radio AGN activity. We note that J0851+4050, J1041+1105, and J1517+0409 are nondetections at 1.4 GHz, and their radio-based SFRs are upper limits.

Figure 7. Comparison of the radio-based SFRs to the host-galaxy SFRs for 15 of the 10 GHz-detected radio sources in our sample of SPMs. J0206−0017, J0843+3549, and J1018+3613 were removed from this analysis due to the presence of an IR AGN. Host-galaxy SFRs were determined using either the IR-corrected FUV (purple circles) or Hα luminosity (black squares). Unfilled data points are nondetections at 1.4 GHz, and their radio-based SFRs are upper limits determined using a 3σ detection threshold from FIRST. Error bars represent the 3σ error in both SFR calculations. Points above the dashed line exhibit radio excess, indicative of an AGN progenitor, while those below may be SF or an AGN.
Download figure:
Standard image High-resolution imageWe now seek to answer what physical process is the dominant means of radio emission for our 10 GHz-detected sample.
6.2. Thermal Emission from Star Formation
The first consideration for the origin of the radio emission is that of thermal bremsstrahlung (free–free) emission produced by ionized hydrogen in active SF regions. In the optically thin regime, radio emission dominated by a free–free component is characterized by a flat spectral index of α = −0.1 (Condon 1992; Murphy et al. 2011; Klein et al. 2018). Each of the four non-radio-excess sources are in the optically thin regime at GHz frequencies, as indicated by their broadband radio spectrum (see Figure 4 for J1015+3914, J1445+5134, and J1617+2512, and Figure 5 for J1041+1105). However, their optically thin spectral index values, , range from −1.19 to −0.64, with J1041+1105 having a lower limit of −1.43. Although there may be a contribution from free–free emission in each of these radio sources, it is clear from their spectral index values that free–free emission is not the dominant radio-emission mechanism for any. This is not unexpected, as free–free emission from H ii regions does not usually dominate the radio spectrum for ν < 10 GHz (Condon 1992; Murphy 2013).

6.3. Radio Supernova and Supernova Remnants
Our second consideration for the origin of the nuclear radio emission in our SPM sources is from nonthermal emission produced by either an individual RSN or a population of SNRs. We first consider an individual RSN as the progenitor for the radio emission. RSNe are morphologically compact radio sources that span a range of radio luminosity (Weiler et al. 2002) and spectral index values (Bendo et al. 2016; Galvin et al. 2018; Klein et al. 2018; Emig et al. 2020). The radio emission associated with a RSN is powered by synchrotron processes. Generally, for SF galaxies, this synchrotron emission is diffuse, tracing the host galaxy's morphology. In the optically thin regime, RSNe associated with a Type Ib/c event have α < −1 (Sν ∝ να ), while those associated with a Type II event have a shallower spectral index α > −1 (Weiler et al. 2002). The radio luminosity of an individual RSN will peak a few hundreds of days after the initial supernova (SN) explosion, reaching a maximum 5 GHz luminosity of L6 cm peak ≈ 1.3 × 1027 erg s−1 Hz−1 (Weiler et al. 2002). However, two of the most luminous RSNe, SN1998bw (Kulkarni et al. 1998) and PTF11qcj (Corsi et al. 2014; Palliyaguru et al. 2019), have a peak luminosity value as high as 1029 erg s−1 Hz−1 at 5 GHz. We take this spectral luminosity to be the upper limit to what a RSN can achieve and compare this to the expected 5 GHz luminosity for each of our SPM detections.
We use for each source (Table 3, column 4) to interpolate the 5 GHz flux density and luminosity. After interpolation, two of the 15 detections have a 5 GHz luminosity greater than 1029 erg s−1 Hz−1: J0759+2750 and J1304+6520. All of the sources with a lower limit to are below this luminosity. The remaining 13 have a median luminosity value of 4.3 × 1028 erg s−1 Hz−1, which is only a factor of 2.3 lower than this RSN luminosity limit. While the spectral index and luminosity values do not rule out the individual RSN origin for these 15 sources, it is extremely unlikely that each radio source is associated with an individual, extremely luminous, nuclear RSN. Nonetheless, we pursue a more robust argument to rule out this scenario.


Chomiuk & Wilcots (2009) determined an expression that relates the maximum 1.4 GHz luminosity of a RSN to the SFR of its host galaxy:

where the 1.4 GHz luminosity is in units of 1024 erg s−1 Hz−1 and the SFR is measured in solar masses per year.
For a given SFR, we first use this relation to determine the maximum 1.4 GHz luminosity of a RSN, then extrapolate this to a 10 GHz luminosity to compare to our VLA sources. There is some freedom here in which value to choose for the spectral index. Chomiuk & Wilcots (2009) use α = −0.5 when deriving the synchrotron emission from a RSN. This comes from the assumption that the cosmic-ray (CR) energy spectrum is a power law of the form E−2, which gives a synchrotron spectral index of αsyn = −0.5. However, focusing on the most luminous RSNe, SN1998bw has a steeper spectral index of αsyn = −0.75 (Chevalier & Fransson 2006), and PTF11qcj has a varying late-time spectral index αsyn ≳ −1 (Corsi et al. 2014). Björnsson (2013) note that the spectral index should approach a value of αsyn = −1 in the optically thin regime, and, indeed, this is in agreement with those values listed in Table 1 of Chevalier & Fransson (2006). For our analysis, we have used a spectral index value of αsyn = −0.5, as is done in Chomiuk & Wilcots (2009). We chose this spectral index value because it is the shallowest among those discussed. Thus, if any of our sources lie above the extrapolated RSN luminosity using a spectral index value of αsyn = −0.5, they will certainly do the same for a steeper spectral index value. Using this method, we find that the observed 10 GHz luminosity of each radio source is greater than the expected luminosity of an individual RSN by at least a factor of 12. It is evident that an individual, luminous RSN is not responsible for the radio emission in these SPM galaxies.
We now consider that a population of SNRs is the dominant progenitor of the radio emission in the four nonexcess sources. However, the spectrum of J1617+2512 peaks at a frequency of 1.1 GHz. The integrated spectrum of a population of SNRs is not expected to peak at GHz frequencies due to the sustained, high injection energy required for such a model. It is likely that the radio emission is dominated by a low-luminosity AGN in this case, and we classify it as such. For the remaining three nonexcess radio sources, it is likely that their radio emission is produced by an integrated population of SNRs. Only J1015+3914 is hosted by a SF galaxy as determined by its optical emission-line ratios. J1445+5134 is hosted by a SF-AGN composite galaxy and J1041+1105 by a LINER.
The median spectral luminosity at 10 GHz of these three radio sources is 2.3 × 1028 erg s−1 Hz−1. For comparison, the nuclear starbursts identified by Song et al. (2022) in a sample of 63 local (U)LIRGS with SFRs in the range of 0.14–13 M⊙ yr−1 have a median spectral luminosity of 5.8 × 1027 erg s−1 Hz−1, or about a factor of 4 lower than what we have found for our radio SF sources. However, similar luminosity radio SF sources do exist: NGC 4945, a powerful, local starburst with a SFR of 1.5 M⊙ yr−1, has a spectral luminosity at 10 GHz of 2.4 × 1028 erg s−1 Hz−1 (Lenc & Tingay 2009). To emphasize, only J1015+3914 may be powered by SF processes alone, as determined by its emission-line ratios. The other two may have contributions from another ionization process, e.g., an AGN. Interestingly, this source has the highest 10 GHz luminosity (4.3 × 1028 erg s−1 Hz−1) of any of the nonexcess sources.
Among these sources with a detection in the FIRST catalog, none are resolved at the spatial scales probed by the 5'' FIRST beam. That is, they do not display the diffuse emission morphology that is characteristic of synchrotron emission from SNRs. This morphology does become more apparent at low frequency (LoTSS or RACS), and at higher spatial resolution for a few sources, e.g., J1015+3914 (Figure A6), though remains elusive at GHz frequency in others, e.g., J1041+1105 (Figure A8). This is discussed in more detail for each individual source in the Appendix. Deeper observations at 1.4 and 3 GHz may reveal lower-surface-brightness emission indicative of this characteristically diffuse nature.
6.4. Active Galactic Nuclei
For the 12 radio-excess sources, it is likely that their radio emission is dominated by an AGN component. We did not find a one-to-one match between the radio AGN classification and that derived from our BPT analysis (Section 5.1). Instead, the radio AGNs are found to occupy host galaxies located in all categories of the BPT classifications: J1113+2714 and J1135+2913 are SF; J0759+2750, J0916+4542, and J1617+2512 are SF-AGN composites; J1304+6520 and J1433+3444 are Seyfert AGNs; J0851+4050 and J1511+0417 are LINERs; and J1511+2309, J1517+0409, and J1655+2639 are hosted by quiescent systems. In addition to these 12, we have already concluded that the radio emission in J0206−0017, J0843+3549, and J1018+3613 is each associated with an AGN. From the emission-line perspective alone, this indicates that radio AGN activity may be present during an ongoing or recent stage of star formation activity in the host SPM. In total, we find that the nuclear radio emission for 15 of the 18 sources at 10 GHz, or 83%, is dominated by a radio AGN.
We begin by discussing the three radio sources hosted in quiescent emission-line galaxies: J1511+2309, J1517+0409, and J1655+2639. As noted before in Section 5.1, the spectra of J1511+2309 and J1655+2639 contain Hβ absorption that is most likely from a stellar origin due to its absorption trough being centered on the rest-frame Hβ wavelength. Because there is not a significant detection of any Hβ emission in these two spectra, we have classified them as quiescent, even though the [O iii]λ5007, Hα, and [N ii]λ6583 lines are detected with a S/N ratio >3. The radio-emission properties, however, indicate the clear presence of radio AGN activity, as we discuss further in this section.
J1517+0409 is unique among these quiescent emission-line SPMs and radio AGNs. The optical spectrum for this SPM is largely featureless: only the [N ii]λ6583 line is detected at >3σ. Additionally, it is the only 10 GHz-detected radio source with a detection at 3 GHz but none at 1.4 GHz. The similar 3 GHz flux density (393 μJy) and 3σ FIRST upper limit (450 μJy) provide evidence that the radio spectrum may be peaking around 3 GHz. We have already shown that J1517+0409 is not an individual RSN (Section 6.3), and, as we discussed for the radio spectrum of J1617+2512, a GHz-peaked spectrum cannot be associated with integrated SNR populations, leaving an AGN as the only plausible progenitor model.
J0851+4050 is the only other radio AGN without a 1.4 GHz detection. However, it would require a 1.4 GHz flux density of 172 μJy for the radio-based SFR to match the SFR determined through host-galaxy properties. If this were true, its radio spectrum would also be optically thick at 1.4 GHz, requiring this source to peak at a frequency above this. Similar to J1517+0409, this provides significant evidence that its radio emission is associated with an AGN, even when considering the upper limit to the radio-based SFR we have used in our radio-excess analysis.
6.4.1. Radio AGN Morphologies
For these radio AGNs, almost all of them display only a single-component morphology except for J0843+3549, J1433+3444, J1511+0417, and J1511+2309. The majority of these radio AGNs do not have collimated jets and/or extended lobe emission that is easily and clearly identifiable in any of their intensity maps (see the Appendix for all intensity maps). This is perhaps unsurprising given that almost all of our 10 GHz sources are low luminosity, whereas luminous radio AGNs are ubiquitously associated with highly relativistic emission arising from radio jets. Yet, the majority of our sources are also not dominated by flat-spectrum radio cores. These objects are identified via their unresolved radio emission, flat spectral index (α ≥ −0.5), and high brightness temperature, indicative of nonthermal emission, and are almost always associated with an AGN. J0206−0017, J1433+3444, and J1511+0417 are the most likely sources to contain a dominant radio core when considering their unresolved morphology and flat spectral index values (Table 3). Indeed, this is the case for J0206−0017, as VLBI observations by Walsh et al. (2023) revealed that the radio emission remains compact down to parsec scale, retains its flat spectral index, and shows chromatic variation in its position, confirming its radio-core nature. J0851+4050, J0916+4542, J1113+2714, and J1517+0409 only have lower limits to their spectral index value so the true nature of their radio AGN emission is ambiguous.
It is evident from the ratio of peak to integrated flux density at 10 GHz that some of our single-component sources are marginally resolved (Figure 3). Since there is little evidence for kiloparsec-scale radio jets or lobes at GHz frequencies, aside from J0843+3549, J1511+0417, and J1511+2309, this marginally resolved nature of the nuclear emission could be an indication of young or frustrated radio jets which are confined to only the central, subkiloparsec region of their host galaxy. J1655+2639 is the most identifiable example of this scenario. The radio emission is marginally resolved along a linear feature (VLA X panel of Figure A18) that has a steep spectral index of .

Alternatively, the marginally resolved nature of some of these radio AGN sources can be explained by the presence of nonthermal emission associated with star formation. As noted, two of our radio AGN sources are hosted by SF emission-line galaxies, and three more are classified as SF-AGN composites. J0759+2750, hosted by a SF-AGN composite galaxy, is perhaps an archetypal source for SF and AGN activity because its 1.4 GHz radio luminosity is >3σ higher than what is expected from star formation alone, but the 10 GHz morphology shows both a diffuse, nonlinear component and an unresolved component (VLA X panel of Figure A2).
Like J0759+2750, J1135+2913, hosted by a SF galaxy, shows low-surface-brightness emission in its 10 GHz map (VLA X panel of Figure A10). However, the diffuse emission in J1135+2913 forms a linear feature. This is particularly evident once this source is imaged with a UV taper to create a lower-resolution map at 10 GHz. It is likely that this feature is a radio jet associated with the radio AGN, like J1655+2639, though we cannot rule out that there is no contribution to the diffuse radio emission from star formation processes.
The diffuse emission of J1304+6520 is more difficult to interpret (Figure A11). Like J0759+2750, the 1.4 GHz radio luminosity of J1304+6520 is >3σ higher than what is expected from star formation alone. However, unlike J0759+2750, J1304+6520 is hosted by a Seyfert AGN emission-line galaxy. So, if this diffuse emission is from SF processes, it is not evident that such would be the case from its optical emission lines. To test if this diffuse emission would resolve into a jet-like feature, we created 10 GHz maps using different weighting schemes. However, these maps did not provide clear evidence of a radio jet. Further observations are required to ascertain the nature of this radio emission. For this analysis, we cannot conclusively determine the emission is from a jet, and do not count it as such as a result.
Lastly, J0843+3549 shows evidence for a precessing radio jet. The morphology of the radio AGN in each of its intensity maps shows a compact region with a small extension, most likely attributable to a small-scale radio jet. The position angle (PA) of the jet varies from 156° ± 10° in its FIRST map to 0.2° ± 11.4° in its 10 GHz map, nearly aligning with the second radio component detected at this frequency (Figure A3). The different observing frequencies and angular resolutions probe different timescales, through both electron population and spatial scale arguments, in the AGN's evolution. Thus, we propose that the significant variation in PA is indicative of time evolution of the radio jet axis. Precessing jets have been identified in a number of jetted radio AGNs when considering time-domain and/or multispatial-scale arguments such as M81 (Martí-Vidal et al. 2011; von Fellenberg et al. 2023), 3C 345 (Kollgaard et al. 1989; Caproni & Abraham 2004; Lobanov & Roland 2005), M87 (Cui et al. 2023), and the SMBHB candidate OJ287 (Britzen et al. 2018). Additionally, the cospatial alignment of the extended jet and resolved second component in the 10 GHz map provide evidence for a common origin of both features. If the second component is a previously ejected synchrotron knot from the radio jet, the PA offset between it and the jet feature at 1.4 GHz, measured to be ΔPA ≈ 171°, also provides evidence in favor of a precessing jet hypothesis. To confirm if the jet of J0843+3549 is precessing requires further observations over a wide frequency and angular resolution coverage to test for systematic variations in PA over these spatial scales. VLBI observations would provide strong evidence to test this hypothesis through the (mis)alignment of the parsec- and subkiloparsec-scale jet features.
In total, four of the 15 radio AGNs in our sample (27%) show evidence for a compact radio jet from their morphology.
6.4.2. Dual AGN Candidates
J0843+3549 and J1511+0417 are both radio doubles; that is, they show two morphologically distinct radio components (see Figures A3 and A14). For both, the radio AGN is likely hosted by the southern, dominant component in each source. The two-point spectral index value for these dominant components is −0.60 ± 0.13 and 0.19 ± 0.03 for J0843+3549 and J1511+0417, respectively. J0843+3549 is thus a candidate compact steep-spectrum (CSS) object, which are compact radio sources less than 20 kpc in linear size and have α ≤ −0.5 (O'Dea & Saikia 2021). J1511+0417 is host to a radio core, as is evident by the inverted spectral index and unresolved morphology of the southern component. The two components are separated by 1.6 kpc for J0843+3549 and 2.1 kpc for J1511+0417. For both systems, there is no clear radio emission which connects the dominant source to the weaker one. J1511+0417 is particularly noteworthy because of the colocation of the northern radio component with a second optical nucleus. Although this galaxy merger is classified as a post-merger system, which are defined as containing only a single optical nucleus, it is clear through the visual identification of distinct optical nuclei that this system is in an earlier stage of galaxy merger evolution, prior to the merging of the stellar nuclei. Indeed, this is corroborated by the Gaia photometric catalog containing an additional source identification at the location of the northern optical nucleus. The northern radio component has a two-point spectral index of −0.60 ± 0.04, also making it a candidate CSS object. These characteristics make J1511+0417 a candidate dual AGN (DAGN).

J0843+3549 has also been identified as a DAGN candidate by previous work. Using deep near-IR imaging, Koss et al. (2018) revealed a population of hidden nuclear mergers in a sample of heavily obscured, hard-X-ray-selected AGNs. They identified a second IR source in the central kiloparsec of this optically selected post-merger galaxy that was blended into the optical nucleus in its low-resolution SDSS image. We identified two radio components in J0843+3549, the dominant of which is cospatial with the central IR/optical component, with the second component found to the north of this. However, Koss et al. (2018) identified the second IR nucleus located 2.9 kpc to the east of the dominant component. If indeed the second IR nucleus of Koss et al. (2018) is associated with this galaxy merger and not a chance projection, we find no evidence of radio emission associated with it in our 10 GHz map, down to a 3σ luminosity limit of 2.7 × 10²⁰ W Hz−1. We require further observations of J0843+3549 to confirm the nature of the northern radio source, since the two components are blended in the VLASS Quick Look image and we do not have lower-frequency observations of higher resolution such as for J1511+0417.
7. Discussion
7.1. Prevalence of Low-luminosity Radio Emission
Much attention has been given in recent years to studying the connection between merging galaxy systems and the triggering of a jetted or low-luminosity AGN (Ramos Almeida et al. 2011, 2012; Bessiere et al. 2012; Chiaberge et al. 2015; Kozieł-Wierzbowska 2017; Pierce et al. 2022). The general finding is that jetted AGNs are almost always associated with merging galaxy systems, while the fraction of low-luminosity AGNs hosted by merging galaxies is often indistinguishable from nonmerging systems (Chiaberge et al. 2015), suggesting that a low-luminosity radio phase is ubiquitous in the formation of all early-type galaxies (Ramos Almeida et al. 2013). This is particularly striking given that 89% (16/18) of the radio emission we detected is low luminosity, whether its origin be from an AGN, SF, or a combination of both, and 87% (13/15) of the radio AGNs are inconsistent with a classic relativistic jet progenitor. From the overall sample, this translates into 57% (16/28) of our post-mergers hosting low-luminosity radio emission, 46% (13/28) hosting a radio AGN without evidence for a relativistic jet, and 7% (2/28) hosting a jetted AGN.
We emphasize important distinctions between our study and those focusing on the incidence of galaxy mergers in radio-emitting systems. These studies (e.g., Chiaberge et al. 2015; Breiding et al. 2024) placed constraints on the merger fraction of AGN host galaxies; they began by selecting for a sample of luminous quasars and examined the host-galaxy morphology for signs of ongoing or recent gravitational interaction. Our sample, however, is of known merging galaxies that were selected because of their host-galaxy morphology and the presence of a single optical nucleus (C12). Then, the merger fraction for our low-luminosity and jetted radio AGN samples is unity by definition; that is, 100% of the radio AGNs are hosted by mergers. We cannot make direct comparisons to similar, though distinct, AGN-merger studies because of the contrasting selection criterion used for the different samples. Additionally, this means that the C12 sample is unbiased toward AGN activity, whereas previous studies either favored, or outright required, the identification of a radio AGN. The nature of our study is to holistically examine the radio properties of these post-merger galaxies and constrain the progenitor of their radio emission, including SF-related activity. This is not to say that previous works have found that all merging galaxies will produce a jetted AGN; such a case is clearly unrealistic by the existence of inactive merging galaxy systems, as is the case for a number of the SPMs in both their radio emission and optical emission-line activity presented in this work.
The deep nature of our observations may also play a key role in the high fraction of low-luminosity radio AGNs in our sample. The sensitivity limits from ongoing and past GHz-frequency radio surveys are close to, if not more than, an order of magnitude less sensitive than what we achieved with our 10 GHz observations. Without the high-significance 10 GHz detection revealed by our observations, a number of these radio sources would be classified as nondetections by standard survey selection criteria, which are often ≥5σ, and thus would be excluded from such a study examining the link between merging galaxies and the incidence and luminosity of radio AGN emission. However, because of the 10 GHz detection that is cospatial with the low-significance radio emission revealed by these surveys, we are confident that this emission is of astrophysical origin and should be examined as such. Again, the nature of our study makes it impractical to compare our detection rates to the merger fraction of AGN hosts from previous studies. Nonetheless, it is expected that with deeper, more sensitive observations, the number of low-luminosity radio AGNs hosted by galaxy mergers will increase. Such observations are required to attain a full representation of the low-luminosity AGN population, as is evidenced by the high fraction of these AGNs in our post-merger sample.
7.1.1. The Role of Mergers in Triggering Low-luminosity Radio AGN
The predominance of low-luminosity AGNs among our radio AGN sample points to a scenario in which the majority of the SMBHs powering these AGNs have low black hole spin values. This comes from the framework first proposed by Blandford & Znajek (1977), in which the energy extracted from a spinning black hole via a highly magnetized accretion disk results in the launching of a jet. The radio luminosity dichotomy can then be explained by the SMBH possessing either a low or high spin (Wilson & Colbert 1995).
Because these radio AGNs are hosted exclusively by post-merger galaxies, we can explore this SMBH spin paradigm from an interesting perspective: namely, the coalescence of a SMBHB. Wilson & Colbert (1995) proposed that the mass ratio of the SMBHB imposes significant evolutionary effects on the luminosity behavior of the coalesced SMBH. Only for SMBHBs with a mass ratio of order unity, with each SMBH of high mass (≥108 M⊙), will the resultant coalesced SMBH be highly spinning and thus able to form a jetted radio AGN. This event is intrinsically rare, since the mass function of SMBHs declines for high mass values (McLure & Dunlop 2004; Hopkins et al. 2006; Gültekin et al. 2009), making the formation of such a SMBHB rare as well. Leaving out J1511+0417, which is not a post-merger system and likely would not yet have formed a SMBHB, the jetted systems are outnumbered by the low-luminosity radio AGNs in our sample by a factor of 6.5, which is consistent with the broad expectations of the Wilson & Colbert (1995) framework.
There is observational evidence to support the merger-spin framework to explain the luminosity dichotomy. de Ruiter et al. (2005) and Capetti & Balmaverde (2006) have found that jetted radio AGNs are ubiquitously hosted by cored galaxies, i.e., those that show a flattening of their power-law surface-brightness distribution at decreasing distance from the optical nucleus. Cored galaxies themselves are products of SMBHB evolution: Once the SMBHB reaches parsec separation, it will scatter stars whose orbits form close encounters with itself, creating the cored brightness distribution profile of the post-merger galaxy (Merritt & Milosavljević 2005). Then, at least a subset of cored post-merger galaxies will host a coalesced SMBH, some of which may form a low-luminosity radio AGN and a rare few a jetted AGN. This gives a self-consistent model for the triggering and high relative fraction of low-luminosity AGN emission we have discovered in our sample of post-merger galaxies. Follow-up radio and optical observations would be needed to test this hypothesis for our sample of post-mergers. VLBI is needed to probe the state of any SMBHB in these radio AGNs. In Section 8, we present the results of simulated observations using the current and next-generation VLBI instruments to ascertain the feasibility of these studies. Space-based or adaptive optics optical observations would be needed to model the brightness distribution profiles of these post-mergers to assess if they are truly cored galaxies.
Alternatively, accretion can lead to a spinning up of the SMBH. As discussed in Volonteri et al. (2013) and Chiaberge et al. (2015), coherent accretion, i.e., where the accreted material has a constant angular momentum axis, will lead to a spinning up of the single SMBH. However, this naturally requires the accretion to be constant over a significant time evolution, which, in turn, requires a large gaseous reservoir for the SMBH to reside in. For gas-rich galaxy mergers, it is well established that such a reservoir can be created via tidal torquing of the gas, which drives it toward the nucleus where it forms a circumbinary disk (Di Matteo et al. 2005). By examining the colors of the SPM sample, C12 concluded that at least 55% of these SPMs are the product of a galaxy merger consisting of one or more late-type, e.g., gas-rich, galaxies. This accretion-driven spin-up of the SMBH may be a plausible origin for the radio emission in a subsample of these SPMs. However, it should be noted that this framework can only produce jetted radio AGNs; the low-luminosity radio AGNs require an alternative explanation.
7.2. Impact of AGN Feedback
Important to the overall discussion of post-merger evolution is an AGN's ability to either trigger or cut off star formation in post-mergers through AGN feedback. The centralization of gas that occurs during a gas-rich galaxy merger can both fuel accretion to power an AGN and also act as a catalyst for triggering starburst activity. The chronology of these two processes is crucial: If the AGN activity is not prompt during the starburst period, AGN feedback will have little to no effect on the SFR of the host galaxy (Kaviraj et al. 2015; Shabala et al. 2017).
Kaviraj et al. (2015) found that the host galaxies for a sample of VLBI-detected, merger-triggered radio AGNs were a factor of 3 more likely than stellar mass- and redshift-matched inactive early-type galaxies to lie on the UV-optical red sequence. Using this and timescale arguments, the authors argue that these merger-triggered radio AGNs are inefficient at regulating the star formation in the host galaxy. Shabala et al. (2017) found a similar result for VLBI-detected radio AGNs hosted by gas-rich minor mergers. By reconstructing the SF history of the host galaxies, they found that none of the radio AGNs were triggered within 400 Myr of the onset of the starburst activity in the host, limiting their ability to impact the overall SFR. C12 also found that the fraction of SF galaxies peaks in ongoing mergers, but the fraction of optical AGNs peaks in post-merger systems, indicating different triggering times for these two processes during the merger evolution.
Our radio-detected sources span a broad expanse of radio luminosity and dominant emission mechanisms. As shown in Section 6.3, three of these sources are likely dominated by emission from SNRs associated with past or ongoing star formation. Two of these three radio sources are hosted by LINER or SF-AGN composite emission-line galaxies. These two may represent the very earliest stages of AGN feedback occurring in the post-mergers, as there is evidence for both an AGN and recent SF activity, or at least ambiguously for the LINER. On the other hand, five of the likely radio AGNs are hosted by either SF or SF-AGN emission-line galaxies. These may represent the next stage of AGN feedback, as the AGN is now the dominant radio-emission mechanism, outshining in the radio band the total emission from the SNRs associated with the star formation. There is multiwavelength evidence for potential feedback processes occurring in at least these seven post-mergers based on their radio and emission-line activity, though, as shown in Section 6.1, almost all of the post-merger galaxies appear to be forming stars at a rate ≥1 M⊙ yr−1. Although for the star-formation-dominated radio sources we cannot estimate the effect of an AGN-powered jet on feedback, we can discuss how our population of radio AGNs fits within the realm of AGN feedback.
Establishing the total AGN jet power from its radio luminosity is not straightforward (see Godfrey & Shabala 2016). However, the capability of the jet to substantially impact the surrounding ISM, creating feedback, can be broadly interpreted even from an order of magnitude estimation. We used the relation of Cavagnolo et al. (2010) to estimate the jet power for each of the radio AGNs in our sample. We found a range of jet powers spanning 1041–1043 erg s−1, making these low-power radio jets. These jet powers are actually favorable for feedback process: Low-power jets, confined to the central kiloparsec of the host, are more effective at large, sustained disruption of the surrounding ISM compared to high-power jets that easily puncture through the dense circumnuclear ISM and remain collimated at large distances from the launching region (Mukherjee et al. 2016). Indeed, the compact morphology of the radio sources favors this scenario, as none of the radio AGNs show collimated jets beyond the nuclear region of their host galaxy. In conjunction with the substantial SFRs of the host post-merger galaxies, this makes these sources good candidates to study the impact of AGN feedback in post-merger galaxies by searching for AGN-triggered bursts of SF activity (positive feedback) and/or multiphase outflows (negative feedback).
7.3. Spectral Index of SF-related Emission
In the GHz regime, radio emission related to the shocks propagated by SNRs is optically thin, with a canonical spectral index value α ∼ −0.8 (Condon 1992). By comparing the radio-based SFR to that derived from host-galaxy properties, we have identified three compact, nuclear, 10 GHz radio sources that are likely dominated by SF-related processes. Among these, we have placed strict constraints on the optically thin spectral index for two of these sources using their 3 and 10 GHz flux densities. These two radio sources have a median optically thin spectral index , significantly steeper than the canonical value of α ∼ −0.8. Such a difference may be cause for concern. However, recent work by Klein et al. (2018) has provided a more in-depth analysis of the broadband radio spectra of integrated SNR populations. By using nearly 2 decades of frequency coverage, these authors found that for 14 SF galaxies, the synchrotron spectral index at low frequency, i.e., ν < 1 GHz, was similar to the canonical value. However, in the 1–12 GHz frequency range, the spectra required either a break or an exponential decline, indicating a steepening of the radio spectra. These features would be caused either by significant synchrotron or inverse-Compton loses to the high-energy electrons produced by the SN shocks, although Klein et al. (2018) explain that a cutoff in the synchrotron spectrum is difficult to explain without inducing a single-injection scenario, which is unlikely when considering the integrated properties of a SNR population.

This situation is alleviated somewhat by the emission-line activity for each of the star-formation-dominated radio sources. Only the host of J1015+3614 is identified as a purely SF galaxy from its emission-line ratios, and its radio source has the flattest optically thin spectral index of these sources of interest, with . This is not dissimilar to the spectral index values found for other SF galaxies (Chyży et al. 2018; An et al. 2021), and while slightly flatter than the canonical α ∼ −0.8, this can be explained by the ratio of CR electrons favoring a younger, more energetic population, e.g., due to recent SN activity. J1445+5134's host has been identified as SF-AGN composite by its emission-line ratios, and has a much steeper optically thin spectral index value, −1.19 ± 0.05. These steep spectral index values for SF galaxies have been observed before: Using a sample of 41 6 GHz-detected submillimeter galaxies (SMGs), Thomson et al. (2019) found the median 1.4–6 GHz spectral index for a subsample of bright SMGs to be −1.35 ± 0.24. Additionally, the radio spectra of the bright SMGs showed a steepening at these GHz frequencies when compared to the same spectra at MHz frequencies. Thomson et al. (2019) discussed that such a phenomenon may be caused by the mixing of distinct electron populations accelerated by decoupled processes that dominate at different frequencies and at different spatial scales. We have presented this hypothesis to explain the spectral breaking (Section 5.4) and radio morphology (Section 6.4.1) for a number of different radio sources in our sample. We further extend this idea to the radio emission in J1445+5134. If there is a contribution from both a steep-spectrum radio AGN component and integrated SNR population to the observed radio emission, such a mixing may cause a steepening of the radio spectral index. This would most likely arise from resolution effects, i.e., the diffuse emission from SNRs is resolved out at higher frequency, leaving only the steep-spectrum, compact AGN component. A scenario in which the diffuse emission from SNRs is cut off at higher frequency is unlikely, as discussed previously (Klein et al. 2018). Multiband spectral energy distribution modeling of these sources is needed to better understand the fractional contribution of the AGN (Dietrich et al. 2018; Ramos Padilla et al. 2020).

The remaining star-formation-dominated radio source is J1041+1105. Unlike for the other star-formation-dominated radio sources, we could only place a lower limit on the optically thin spectral index of J1041+1105 () due to the nondetection of any radio emission at 3 GHz. Like J1445+5134, the for this source may also be steeper than expected, given its star-formation-dominated nature. However, when considering the 1.4 GHz flux density limit, which is more sensitive than the 3 GHz limit, the lower limit to the spectral index becomes −0.81. We know, then, that J1041+1105 does not show the same type of highly steep spectral index at GHz frequencies that J1445+5134 exhibits. This may be indicative of the more canonical radio emission associated with SF, like J1015+3614. However, unlike J1015+3614, the host galaxy of J1041+1105 is a LINER. Although the exact nature of LINER emission is ambiguous, the surface-brightness profiles of the low-ionization emission lines found in LINER hosts through integral field spectroscopy favor a scenario in which the ionization is powered by post-asymptotic giant branch stars (Yan & Blanton 2012; Singh et al. 2013). Such a scenario is also favorable due to the ubiquity of these stars in all galaxies, especially those with little active star formation. Radio observations, however, seemingly favor the presence of an AGN over pure SF-related processes to produce the observed radio emission (Filho et al. 2004; Singh et al. 2015). Although J1041+1105 may possibly have an optically thin spectral index close to the canonical SF value of −0.8, more sensitive 1.4 and 3 GHz observations are required to better understand the association of this nuclear radio source to its LINER emission-line host galaxy.


8. Supermassive Black Hole Binaries in Spheroidal Post-merger Systems
8.1. Do Our SPMs Host SMBHBs?
Radio observations are a powerful tool to probe both the kiloparsec- and parsec-scale environment to search for and confirm SMBHB candidates. At kiloparsec scales, the morphology of the extended jets or lobes may hold signatures of SMBHB evolution: an X-shaped morphology due to a coalesced SMBHB (Begelman et al. 1980; Merritt & Ekers 2002), or an S-shaped (helical) morphology due to jet precession caused by a SMBHB (e.g., Rubinur et al. 2017). These radio structures have steep spectral index measurements (α ≤ −0.5), making low-frequency observations particularly advantageous toward their identification. After visual inspection, we find no evidence for any of these kiloparsec-scale SMBHB evolutionary signatures in the radio morphology of these SPM galaxies at any observing frequency (see the Appendix for multifrequency radio maps for each SPM). However, the absence of an S- or X-shaped morphology does not dismiss the possibility that these SPMs may harbor a SMBHB.
Likewise, only two of these SPMs (J0841+3549 and J1511+0417) show any evidence of DAGN behavior, as discussed in Section 6.4.2. Our 10 GHz observations would be the most adept at identifying DAGN candidates because of their sensitivity (nominal image rms ∼15 μJy) and high angular resolution, which would be able to resolve potential blended radio cores in lower-resolution images. Then, we find no evidence for secondary radio emission in the remaining 13 radio AGNs down to a range of limiting 3σ luminosities Lν = 8 × 10¹⁹–7 × 10²⁰ W Hz−1. A second AGN in these systems would be extremely radio faint and require ultra-deep sensitivities to detect. This is also true for the star-formation-dominated sources: We find no evidence of multicomponent radio emission in any of these systems above a 10 GHz luminosity of Lν = 3.7 × 10²⁰ W Hz−1.
Gaia's superb astrometric precision has enabled a number of searches for DAGNs and SMBHBs candidates that utilize astrometric variability induced by photocenter pseudo-motion of the unresolved SMBH pair, or varstrometry (Hwang et al. 2020; Shen et al. 2021; Chen et al. 2022; Schwartzman et al. 2024). This technique is particularly powerful for systems with z > 0.5, as Gaia's astrometry is optimized for compact sources (Makarov & Secrest 2022). Below this redshift, extended features in the host galaxy, e.g., tidal tails, will induce false astrometic noise (Souchay et al. 2022). Because our sample of SPMs were selected to have extended, tidal features and z < 0.1, any analysis using the photometric center from Gaia is unreliable, including searching for offsets in the radio and optical photometric centers.
Then, for the majority of the 10 GHz-detected SPM galaxies in our sample (16/18; 89%), we find no evidence for SMBHB evolution at the (sub)kiloparsec scale. We emphasize, however, that the lack of evidence does not preclude that any of these SPMs may host a SMBHB system.
8.2. Searches with Very-long-baseline Interferometry
VLBI offers a plethora of direct and indirect methods to identify SMBHB candidates. Among these, the identification of dual, flat-spectrum radio cores at parsec-scale separation provides the most compelling evidence of any SMBHB, a technique that is only feasible because of VLBI's milliarcsecond angular resolution. Indeed, this technique has so far provided the best evidence for a SMBHB, hosted in the elliptical galaxy 0402+379, through imaging (Rodriguez et al. 2006) and proper-motion constraints (Bansal et al. 2017). VLBI observations can also provide corroboratory evidence of SMBHB candidates through indirect methods. Significant PA differences between the parsec- and kiloparsec-scale radio jet may be indicative of binary evolution (e.g., Mooley et al. 2018), as the jet opening angle widens as the binary loses energy due to the emission of gravitational waves (Kulkarni & Loeb 2016). Periodic variability observed in both the radio luminosity and radio-core position may be indicative of SMBHB-induced precession of the radio jet of subparsec SMBHB candidates (e.g., Stirling et al. 2003; Sudou et al. 2003; Kun et al. 2014).
We are interested in establishing the feasibility of performing VLBI observations to search for a SMBHB in each of the 15 radio AGNs we have discovered with our 10 GHz VLA observations. We did this by simulating two different VLBI observatories: the VLBA and the Next-Generation Very Large Array (ngVLA-Long). For each frequency band of each array, we calculated the expected continuum rms image sensitivity of a 1 hr long integration and a 10 hr long integration. Here, we are using integration to represent the total time on source for each target of interest. Each observation, encompassing this on-source time, is then necessarily longer than 1 and 10 hr to account for overheads. For the VLBA, we have assumed an efficiency factor ηs of 0.8, and that all 10 antennas, thus 90 baselines, are included for each simulated integration. Our simulated integrations use the L-band (21 cm), S-band (13 cm), C-band (6 cm and 5 cm), X-band (4 cm), Ku-band (2 cm), K-band (1.4 cm), Ka-band (1.25 cm), and Q-band (0.7 cm) receivers for the VLBA. For each frequency band, we have assumed the maximum possible data rate (2048 Mbps for the L and S bands, 4096 Mbps for all others) and used the system equivalent flux density provided for the VLBA. 8 For the simulated ngVLA integrations, we used the ngVLA sensitivity calculator Python script to calculate the expected continuum rms image sensitivity. 9 We did this for each of the central frequencies listed for the VLBA, since the larger bandwidths of the ngVLA receivers encapsulate multiple VLBA receiver frequency ranges. We simulated the 1 and 10 hr long integrations at the first five bands of the ngVLA for this analysis, with central frequencies at 2.4, 8, 16, 27, and 41 GHz. We have not taken into account the RFI environment for any of these simulated integrations. This is especially prevalent at lower frequencies, where up to half of the bandwidth may be unusable due to the persistent, dominating presence of RFI. Each of these simulated integrations is an ideal case and represents a lower limit to what is achievable in actual observations.
To calculate the expected milliarcsecond-scale radio flux density at each frequency, we used the 10 GHz flux density value (Table 2, column 6) and the spectral index value (Table 3, column 4) for each of the radio AGNs. For those radio AGNs with more than one resolved component (J0843+3549 and J1511+0417), we used the 10 GHz flux density value of the dominant radio component. We began by extrapolating the 10 GHz flux density to each of the central frequencies listed above. Here, we have assumed that the broader radio spectrum for each of these radio components follows a simple power law Sν ∝ να , where α is . We have used the 10 GHz flux density values because this represents the best approximation to the radio flux density we would expect from a dominant radio core. All other flux density measurements were taken at lower frequency and angular resolution. Because of this, those flux density measurements are more likely to have contributions from non-core-related phenomena, such as steep-spectrum features, e.g., a radio jet, or star formation, especially for the case of the 144 MHz LoTSS data. Indeed, for sources with tight constrains on , only J0206−0017, J1433+3444, and J1511+0417 have a flat spectral index (α > −0.5) in the optically thin regime, which is expected if the dominant contributor to the radio flux density were from a radio core. This is critical to establishing the expected population of detected radio sources for each of our simulated integrations. If we systematically overestimate the expected milliarcsecond-scale flux density, we will also overestimate the number of significant detections achievable in each of our simulated integrations. We have also assumed that also represents the dominant VLBI component. This certainly does not need to be the case, as even unresolved features at subarcsecond scale may be resolved out at the milliarcsecond scale probed by VLBI observations, possibly revealing a dominant radio core at milliarcsecond scales. However, we are using these values since they best represent the physical situation as we can currently determine. Once again, we only wish to estimate what the VLBI-scale emission properties are; only through actual observation could these flux density values be determined.


After extrapolating the 10 GHz flux density to the designated frequency values, we apply a factor of 0.3 in converting from subarcsecond-scale flux density to milliarcsecond-scale flux density. This value was chosen from the analysis of Deller & Middelberg (2014). In their analysis, those authors determined the ratio of peak VLBI flux density at 1.4 GHz to peak FIRST flux density for a large sample of VLBI sources detected in the mJy Imaging VLBA Exploration at 20 cm survey. Overall, they found that 30%–35% of all sources have compact VLBI emission in which the majority of the FIRST flux is recovered, with this trend increasing toward lower FIRST flux density. Indeed, for FIRST sources with a flux density measuring from 1 to 2 mJy that are detected with VLBI all recover at least 32% of the FIRST flux density value at VLBI scales, with about 25% of sources having greater than 64% of this value recovered. We acknowledge that this extrapolation was determined only for 1.4 GHz observations, whereas our analysis uses the flux density determined at 10 GHz. Our factor of 0.3, then, may even underestimate the VLBI-scale flux density for each source. Though, for the sake of this analysis, this is preferred to an overestimation.
We now have estimations for the VLBI-scale flux density for each of the SPM sources detected with our 10 GHz observations. Figure 8 plots these estimated VLBI-scale flux density values with the simulated continuum image rms sensitivities of a 1 hr long and 10 hr long integration with the VLBA and ngVLA. For each simulated integration, the sensitivity curve represents a 5σ detection threshold. Points that fall above these curves represent a detection, while those below are not expected to be detected. Notably, lower-frequency integrations (ν < 10 GHz) with the VLBA may already achieve a sensitivity to reach a significant detection of VLBI-scale radio emission. While these frequencies may not be optimal for isolating the core emission, the flux density information they provide is nonetheless critical to establishing the spectral index value of the potential radio core associated with each binary constituent. The significant improvement in detection threshold appears in the higher-frequency integrations (ν > 10 GHz). At these frequencies, we expect that the vast majority of sources would not be detected even with a 10 hr integration time using the VLBA. However, with the ngVLA, we find that a 1 hr integration time is sufficient to detect all of the sources at 15 GHz, and the majority of sources at 22, 23, and 43 GHz. These higher-frequency observations are best at isolating the radio core by resolving out larger-scale emission and provide high astrometric precision due to their high angular resolution, critical for establishing SMBHB orbital constraints through proper-motion measurements (Bansal et al. 2017; Wrobel & Lazio 2022).

Figure 8. VLBI-scale flux density estimates of the 15 newly discovered radio AGNs from our sample of SPM galaxies plotted with the simulated, 5σ sensitivity curves of a 1 and 10 hr integration with the VLBA and the VLBI baselines of the ngVLA-Long. These data points represent the potential milliarcsecond-scale integrated flux density of a SMBHB, which can only be resolved with VLBI. Points above a 5σ sensitivity curve indicate a detection. At lower frequency (ν < 10 GHz), the VLBA observations may already reach the desired sensitivity to achieve a significant detection. The notable difference is at higher frequency (ν > 10 GHz), where a 1 hr integration with the ngVLA vastly improves the probability of detection compared to a 10 hr VLBA integration.
Download figure:
Standard image High-resolution image9. Summary
In this paper, we have analyzed the emission properties of a sample of 30 local post-merger galaxies from C12 to search for SF- and AGN-related activity. Our main results are as follows:
- 1.Diverse emission-line activity. Using the optical emission-line flux ratios derived from the OSSY catalog (Oh et al. 2011), and standard BPT diagram analyses, 43% of the post-mergers are optically quiescent, 10% are dominated by SF, 13% by a combination of SF and AGN, 13% by Seyfert AGN, and 20% by LINER activity.
- 2.Low-luminosity radio emission. Of those post-mergers with detected radio emission, through both archival radio surveys and new, high-resolution, 10 GHz observations with the VLA, the vast majority of the associated radio sources are low luminosity, with only two above the luminosity threshold (ν Lν > 1032 W) to be classified as jetted radio AGNs. We discovered a number of nuclear radio sources at high significance (≥5σ) with our 10 GHz observations that were otherwise nondetections by archival radio surveys, emphasizing the importance of deep observations to reveal the full population of low-luminosity sources.
- 3.Prevalence of compact radio emission. At the largest spatial extents, sampled by 144 MHz LoTSS observations, all of the detected radio sources have a diffuse or extended emission component. Only J0843+3549 and J1433+3444 display an AGN-like morphology among these 144 MHz sources. At 1.4 GHz (5'' resolution), we find little evidence of kiloparsec-scale structures, indicating that compact, nuclear emission is prevalent in these post-mergers. At the most compact scales, sampled by our 10 GHz observations (≈0.2''), the sources show a variety of AGN- and SF-related morphologies.
- 4.Radio spectra and spectral index measurements. Of the 12 radio sources with a well-sampled (four or more detections) spectrum, we identified five that showed evidence of significant curvature (∣q∣ ≥ 0.2) in their broadband spectrum. Two spectra were found to be inverted (q ≥ 0.2), though we believe this is likely due to an overall flattening of the spectrum at high frequency and not a true inversion. The poor statistical power-law fits to a number of spectra is explained by variability at one or more flux values, or a blending of two distinct electron populations at low angular resolution. We also determined the two-point spectral index value to the compact radio emission using the 3 and 10 GHz flux density values, or its lower limit for sources without a 3 GHz detection. These values range from 0.19 ≥ α ≥ −1.19, though the majority have a steep spectral index α < −0.5.
- 5.SF activity in post-mergers. We have determined that the radio emission in J1015+3914, J1041+1105, and J1445+5134 is most likely dominated by an integrated population of SNRs. These three radio sources are hosted by a SF, LINER, and SF-AGN composite emission-line galaxy, respectively, providing corroboratory evidence of ongoing or recent star formation activity in each of these post-mergers. It is notable that the spectral index value for two of these three is significantly steeper than the canonical value α ∼ −0.8 for shock-dominated sources (Condon 1992). However, these spectral index values are not dissimilar to those of other shock-dominated sources (e.g., Chyży et al. 2018; Thomson et al. 2019; An et al. 2021), and may be indicative of an older CR electron population due to evolved SN activity. Alternatively, as J1445+5134 is hosted by a SF-AGN composite emission-line galaxy, the steep spectral index may be due to resolution effects in which the diffuse synchrotron is resolved out at higher angular resolution, revealing compact, steep-spectrum AGN emission.
- 6.Discovery of radio AGNs. We have discovered 15 radio AGNs in these post-mergers: three due to their association with a known AGN, one due to its GHz-peaked radio spectrum, and 11 for which we found excess radio emission compared to SF predictors. Eighty-seven percent (13/15) of these radio AGNs are low luminosity, with only 13% (2/15) found to have a luminosity consistent with a relativistic jet. The post-merger hosts are found to occupy all regions of the BPT diagrams, indicating that radio AGN activity may be present even during stages of SF activity of the post-merger evolution. We also report on the discovery of a precessing jet in the DAGN candidate J0843+3549 (Koss et al. 2018), and discover a new DAGN candidate, J1511+0417.
- 7.The origin of radio AGN activity in mergers. The prevalence of low-luminosity AGNs among our radio AGN population lends itself to a scenario in which these AGNs in ongoing or recent galaxy mergers may be more populous than previously believed. Because our sample is comprised of late-stage and post-merger systems, the high fraction of low-luminosity radio AGNs can be explained by SMBH spin-up due to the coalescence of a SMBHB (Wilson & Colbert 1995). In this framework, jetted radio AGNs are only produced for the most massive binary systems, which are intrinsically rare due to the sharp decline at high mass of the SMBH mass function (McLure & Dunlop 2004; Hopkins et al. 2006; Gültekin et al. 2009). Indeed, we have found that the low-luminosity AGNs outnumber the luminous AGNs by a factor of 6.5. Alternatively, gas-rich mergers may produce a jetted radio AGN if the SMBH sustains coherent accretion for an extended period of time. Both scenarios need further observations to test rigorously.
- 8.Jet–ISM feedback. We estimated the total power of the jets for our sample of radio AGNs. The jet powers span a range of 1041−1043 erg s−1, making them low power. The majority of the post-mergers have a SFR ≥ 1 M⊙ yr−1, indicating that the AGN may play an important role in providing positive or negative feedback. Importantly, these low-power jets, confined to the central kiloparsec of the host, are more effective at large, sustained disruption of the surrounding ISM compared to high-power jets that easily puncture through the dense circumnuclear ISM and remain collimated at large distances from the launching region (Mukherjee et al. 2016). Indeed, the compact morphology of these radio sources agrees with this scenario. These radio AGNs are then good candidates to study the impact of AGN feedback in post-merger systems by searching for signatures of multiphase gas outflows.
- 9.Next-generation searches of SMBHBs. Lastly, we simulated 1 and 10 hr integrations at multiple frequencies with the VLBA and the VLBI capabilities of the ngVLA-Long. These simulations present the necessary integration times for each instrument to reach the deep sensitivities required to perform robust searches for a SMBHB in each of these radio AGNs hosted by a post-merger galaxy. We estimated the milliarcsecond-scale flux density of the radio source using for each radio AGN and additional factors from the literature (e.g., Deller & Middelberg 2014). We found that at low frequency (ν < 10 GHz), the VLBA can already perform these robust searches, though the low-frequency, milliarcsecond environment of radio AGNs will often be dominated by extended, steep-spectrum emission, making radio-core identification difficult. The ngVLA will be a particularly powerful instrument for searches of SMBHBs at high frequency (ν > 10 GHz), where the dual, flat-spectrum cores of the SMBHB are the dominant emission signature. These high-frequency, high-angular-resolution observations also offer significantly better astrometric precision than low-frequency observations, which will be important for constraining proper-motion measurements of the SMBHB constituents.


Our study of the multiwavelength emission properties of 30 post-merger galaxies has discovered a number of exciting phenomena and individual sources. Future work on this topic will expand the sample population of post-merger galaxies, include better frequency coverage, and examine the radio emission of galaxy mergers at various stages of their evolution. This work will further our understanding of the astrophysical processes occurring during the merger sequence, the impact of AGN feedback, and establish new radio sources to follow-up with VLBI with the hope of detecting individual SMBHBs.
Acknowledgments
We thank the anonymous referee for providing their insightful comments that improved the subtleties in our analyses and text. G.W. and S.B.S. were supported in this work by NSF award grant No. 1815664. We thank Amy Reines for the discussions on multiwavelength analyses to determine the origin of radio emission, and Julie Comerford for recommendation of the OSSY catalog to perform our optical spectral analysis. Some of the data presented in this paper were obtained from the Mikulski Archive for Space Telescopes (MAST) at the Space Telescope Science Institute. STScI is operated by the Association of Universities for Research in Astronomy, Inc., under NASA contract NAS5-26555. Support to MAST for these data is provided by the NASA Office of Space Science via grant No. NAG5-7584 and by other grants and contracts. This publication makes use of data products from the Wide-field Infrared Survey Explorer, which is a joint project of the University of California, Los Angeles, and the Jet Propulsion Laboratory/California Institute of Technology, funded by the National Aeronautics and Space Administration. The National Radio Astronomy Observatory is a facility of the National Science Foundation operated under cooperative agreement by Associated Universities, Inc. The NANOGrav collaboration, which funded some components associated with this research, receives support from National Science Foundation (NSF) Physics Frontiers Center award #1430284 and #2020265. This research has made use of NASA's Astrophysics Data System Bibliographic Services.
Facilities: VLA - Very Large Array, LOFAR - , ASKAP - , GALEX - Galaxy Evolution Explorer satellite, WISE - Wide-field Infrared Survey Explorer.
Software: CASA (The CASA Team et al. 2022), Numpy (van der Walt et al. 2011), Scipy (Virtanen et al. 2020), Matplotlib (Hunter 2007), Astropy (Astropy Collaboration 2018).
Appendix: Individual Sources
The criteria for the morphology to be unresolved, resolved, marginally resolved, or multicomponent are described in Section 5.3. The radio contour maps for LoTSS, RACS, FIRST, and VLASS are presented using the nominal image rms of each survey (see Section 4). This does not reflect what the local rms may be for each image, especially for SPMs located near strong sources, which is particularly an issue for the MHz-frequency surveys. If there is a discrepancy between the nominal survey and local image rms for any of our sources that directly affects the morphology or detection level of the source, we note this in the appropriate subsections. The LoTSS, RACS, FIRST, VLASS/VLA S, VLA X, and Pan-STARRs panels are nominally , , , 15'' × 15'', 5'' × 5'', and in size, respectively, unless otherwise noted in the figure caption for each source. The NVSS panel for J1304+6520 is in size.


A.1. J0206−0017
J0206−0017 is a radio AGN associated with the changing-look AGN Mrk 1018 (McElroy et al. 2016; Walsh et al. 2023). The radio emission is resolved by FIRST and unresolved by RACS, and at 3 GHz and 10 GHz (Figure A1). We note that the local image rms of this RACS field is 450 μJy, and thus the compact nature of J0206−0017's 888 MHz radio emission is not truly reflected in Figure A1. The radio spectral index reflects the compact nature of this source, as it is flat with . The broadband radio spectrum is well fit by a curved power law and appears to be inverted (q = 0.29 ± 0.01). This is most likely due to the flattening of the radio spectrum at GHz frequencies and not truly indicative of an inverted spectrum.


Figure A1. Intensity maps and contour overlays, and Pan-STARRS r-band image of the host galaxy of J0206-0017. The synthesized beam is shown in the bottom-left corner for the radio surveys, and a scale bar is shown in the bottom-right corner. Contours are shown at −3, 3, and 5, and increase by a factor of 2 thereafter times the nominal image rms for LoTSS, RACS, and FIRST, and the off-source rms for the VLA S (35 μJy) and VLA X (30 μJy) panels. The Pan-STARRS image has been resampled and falsely colored to emphasize the tidal features of the host galaxy. The local image rms of this RACS field is greater than the nominal image rms of RACS. Thus, the compact nature of J0206−0017's 888 MHz emission is not represented accurately here.
Download figure:
Standard image High-resolution imageA.2. J0759+2750
J0759+2750 is a radio AGN hosted by a SF-AGN composite emission-line galaxy. The radio emission is resolved by both LoTSS and at 10 GHz, marginally resolved by FIRST, and unresolved by RACS and VLASS (Figure A2). The eastern extension to the 144 MHz emission is similar to the tidal feature visible in the host galaxy in that direction but does not overlap perfectly with that feature. The 144 MHz extension is slightly broader in width than the tidal feature. The 10 GHz morphology shows both a diffuse, nonlinear component and an unresolved component, perhaps indicative of both nuclear SF and AGN activity. The spectral index is steep, with . The broadband radio spectrum is well fit by a curved power law, but does not exhibit significant curvature (q = −0.04 ± 0.02).


Figure A2. Intensity maps and contour overlays, and Pan-STARRS r-band image of the host galaxy of J0759+2750. The synthesized beam is shown in the bottom-left corner for the radio surveys, and a scale bar is shown in the bottom-right corner. Contours are shown at −3, 3, and 5, and increase by a factor of 2 thereafter times the nominal image rms for LoTSS, RACS, FIRST, and VLASS, and the off-source rms for the VLA X (13 μJy) panel. The Pan-STARRS image has been resampled and falsely colored to emphasize the tidal features of the host galaxy.
Download figure:
Standard image High-resolution imageA.3. J0843+3549
J0843+3549 is a radio AGN hosted by a Seyfert AGN emission-line galaxy. The radio emission is resolved by LoTSS, FIRST, and VLASS, and shows multiple components at 10 GHz (Figure A3). The extended feature to the compact emission in each map has a varying deconvolved PA from 131.5° ± 5.1° at 144 MHz to −18° ± 15° at 10 GHz. This extreme PA change from kiloparsec to subkiloparsec scales shows that J0843+3549 is likely host to a precessing radio jet. A second resolved component is revealed at 10 GHz located 155 (1.6 kpc at z = 0.054) away from the southern, brighter component. We find no evidence for radio emission associated with the second IR nucleus of Koss et al. (2018), located to the east of the dominant, central component, down to Lν
= 2.7 × 10²⁰ W Hz−1 at 10 GHz. The 144 MHz component located 273 to the southwest is associated with the galaxy cluster GMBCG J130.93151+35.82210 (Hao et al. 2010) at a redshift of z = 0.475 (Rozo et al. 2015). The spectral index is steep, with . However, higher-resolution observations are needed to resolve the independent components and isolate their contributions to the total radio spectrum, as well as measure their separate spectral index values. The broadband radio spectrum is not well fit by either a simple or curved power law. This is likely because we are probing two separate electron populations producing the observed radio emission. The 144 MHz emission probed by LoTSS is most probably associated with SNRs, while at GHz frequencies the radio AGN is the dominant emission component.


Figure A3. Intensity maps and contour overlays, and Pan-STARRS r-band image of the host galaxy of J0843+3549. The synthesized beam is shown in the bottom-left corner for the radio surveys, and a scale bar is shown in the bottom-right corner. Contours are shown at −3, 3, and 5, and increase by a factor of 2 thereafter times the nominal image rms for LoTSS, FIRST, and VLASS, and the off-source rms for the VLA X (13 μJy) panel. The Pan-STARRS image has been resampled and falsely colored to emphasize the tidal features of the host galaxy.
Download figure:
Standard image High-resolution imageA.4. J0851+4050
J0851+4050 is a radio AGN hosted by a LINER emission-line galaxy. The radio emission is marginally resolved by LoTSS, unresolved at 10 GHz, and is a nondetection in FIRST and VLASS (Figure A4). The resolved emission at 144 MHz is perpendicular to the tidal features visible in the host galaxy. Because it is a nondetection at 1.4 GHz, the radio-based SFR we calculated in Section 6.1 is an upper limit. Given this constraint, it still falls in the radio-excess region of Figure 7. More sensitive observations at 1.4 GHz may change this, but our data cannot determine otherwise, hence our classification as a possible radio AGN. Without a detection at 3 GHz, the lower limit to the spectral index is , likely making this a flat-spectrum source. More sensitive observations at 3 GHz are needed to determine if the broadband radio spectrum is better fit by a simple or curved power law and to measure .


Figure A4. Intensity maps and contour overlays, and Pan-STARRS r-band image of the host galaxy of J0851+4050. The synthesized beam is shown in the bottom-left corner for the radio surveys, and a scale bar is shown in the bottom-right corner. Contours are shown at −3, 3, and 5, and increase by a factor of 2 thereafter times the nominal image rms for LoTSS, FIRST, and VLASS, and the off-source rms for the VLA X (13 μJy) panel. The Pan-STARRS image has been resampled and falsely colored to emphasize the tidal features of the host galaxy.
Download figure:
Standard image High-resolution imageA.5. J0916+4542
J0916+4542 is a radio AGN hosted by a SF-AGN composite emission-line galaxy. The radio emission is resolved by LoTSS, and unresolved by FIRST and at 10 GHz (Figure A5). The diffuse emission at 144 MHz is approximately extended along the east–west tidal features of the host galaxy. The radio source located 32'' to the southwest does not appear to be associated with the host SPM, and may either be associated with SDSS J091649.73+454130.4 or may be an FRII-like lobe associated with WISEA J091653.20+454128.7. Without a detection at 3 GHz, the lower limit to the spectral index is . More sensitive observations at 3 GHz are needed to determine if its radio spectrum is steep or flat and to determine if the broadband radio spectrum is better fit by a simple or curved power law.


Figure A5. Intensity maps and contour overlays, and Pan-STARRS r-band image of the host galaxy of J0916+4542. The synthesized beam is shown in the bottom-left corner for the radio surveys, and a scale bar is shown in the bottom-right corner. Contours are shown at −3, 3, and 5, and increase by a factor of 2 thereafter times the nominal image rms for LoTSS, FIRST, and VLASS, and the off-source rms for the VLA X (13 μJy) panel. The Pan-STARRS image has been resampled and falsely colored to emphasize the tidal features of the host galaxy.
Download figure:
Standard image High-resolution imageA.6. J1015+3914
J1015+3914 is a star-formation-dominated radio hosted by a SF emission-line galaxy. The radio emission is resolved by LoTSS and at 10 GHz, and unresolved by FIRST and VLASS (Figure A6). The resolved features at 144 MHz to the northeast are not spatially coincident with the visible tidal features of the host galaxy. The diffuse morphology of the 10 GHz radio emission is highly indicative of recent SF activity. The radio spectrum is steep, with . The broadband radio spectrum is poorly fit by either a simple or curved power law. We hypothesize that this results from two distinct electron populations, one indicative of galactic-scale diffuse emission at 144 MHz, and a second population that is more compact and nuclear, perhaps indicative of more recent, nuclear SF activity. Better sampling of the radio spectrum is needed to confirm this.


Figure A6. Intensity maps and contour overlays, and Pan-STARRS r-band image of the host galaxy of J1015+3914. The synthesized beam is shown in the bottom-left corner for the radio surveys, and a scale bar is shown in the bottom-right corner. Contours are shown at −3, 3, and 5, and increase by a factor of 2 thereafter times the nominal image rms for LoTSS, FIRST, and VLASS, and the off-source rms for the VLA X (12 μJy) panel. The Pan-STARRS image has been resampled and falsely colored to emphasize the tidal features of the host galaxy.
Download figure:
Standard image High-resolution imageA.7. J1018+3613
J1018+3613 is a radio AGN hosted by a Seyfert AGN emission-line galaxy. The radio emission is resolved by LoTSS and is unresolved by FIRST, and at 3 and 10 GHz (Figure A7). The extended feature to the southeast in the LoTSS map is not spatially coincident with the southeast tidal structure visible in the host galaxy. J1018+3613 is one of two radio sources at any frequency that is considered radio loud (ν Lν > 1032 W). The spectral index is steep, with . The broadband radio spectrum is well fit by a curved power law and shows evidence of curvature (q = −0.19 ± 0.02), with a peak frequency at 290 MHz.


Figure A7. Intensity maps and contour overlays, and Pan-STARRS r-band image of the host galaxy of J1018+3613. The synthesized beam is shown in the bottom-left corner for the radio surveys, and a scale bar is shown in the bottom-right corner. Contours are shown at −3, 3, and 5, and increase by a factor of 2 thereafter times the nominal image rms for LoTSS and FIRST, and the off-source rms for the VLA S (15 μJy) and VLA X (10 μJy) panels. The Pan-STARRS image has been resampled and falsely colored to emphasize the tidal features of the host galaxy. The VLA S and VLA X panels are 30'' × 30'' and 10'' × 10'' in size due to the lower resolution at these frequencies of the VLA in the B configuration.
Download figure:
Standard image High-resolution imageA.8. J1041+1105
J1041+1105 is a star-formation-dominated radio source hosted by a LINER emission-line galaxy. The radio emission is resolved by RACS, unresolved at 10 GHz, and is a nondetection by both FIRST and VLASS (Figure A8). The morphology at 888 MHz is difficult to gauge, as the local image rms is ∼470 μJy. When considering this constraint, only the southern radio component shown in the RACS panel of Figure A8, produced using an image rms equal to the nominal survey sensitivity of 250 μJy, remains. Indeed, this southern component is spatially coincident with the host galaxy, while the northern and diffuse components are likely artifacts. Because it is a nondetection at 1.4 GHz, the radio-based SFR we calculated in Section 6.1 is an upper limit. Given this constraint, it still falls in the SF region of Figure 7, hence our classification as a likely star-formation-dominated radio source. Without a detection at 3 GHz, the lower limit to the spectral index is . More sensitive observations are needed to determine if its radio spectrum is steep or flat and to determine if the broadband radio spectrum is better fit by a simple or curved power law.


Figure A8. Intensity maps and contour overlays, and Pan-STARRS r-band image of the host galaxy of J1041+1105. The synthesized beam is shown in the bottom-left corner for the radio surveys, and a scale bar is shown in the bottom-right corner. Contours are shown at −3, 3, and 5, and increase by a factor of 2 thereafter times the nominal image rms for RACS, FIRST, and VLASS, and the off-source rms for the VLA X (12 μJy) panel. The Pan-STARRS image has been resampled and falsely colored to emphasize the tidal features of the host galaxy. The local image rms of this RACS field is greater than the nominal image rms of RACS. Thus, the morphology of J1041+1105's 888 MHz emission is not represented accurately here.
Download figure:
Standard image High-resolution imageA.9. J1113+2714
J1113+2714 is a radio AGN hosted by a SF emission-line galaxy. The radio emission is unresolved by RACS and at 10 GHz, marginally resolved by FIRST, and is a nondetection by VLASS (Figure A9). The unresolved emission is spatially coincident with the optical nucleus of the host galaxy. Without a detection at 3 GHz, the lower limit to the spectral index is . More sensitive observations are needed to determine if its radio spectrum is steep or flat and to determine if the broadband radio spectrum is better fit by a simple or curved power law.


Figure A9. Intensity maps and contour overlays, and Pan-STARRS r-band image of the host galaxy of J1113+2714. The synthesized beam is shown in the bottom-left corner for the radio surveys, and a scale bar is shown in the bottom-right corner. Contours are shown at −3, 3, and 5, and increase by a factor of 2 thereafter times the nominal image rms for RACS, FIRST, and VLASS, and the off-source rms for the VLA X (12 μJy) panel. The Pan-STARRS image has been resampled and falsely colored to emphasize the tidal features of the host galaxy.
Download figure:
Standard image High-resolution imageA.10. J1135+2953
J1135+2953 is a radio AGN hosted by a SF emission-line galaxy. The radio emission is resolved by LoTSS, VLASS, and at 10 GHz, and marginally resolved by FIRST (Figure A10). The extension to the northwest in the LoTSS map is similar in PA to the tidal feature visible in the host galaxy, though the two features do not perfectly align. The emission becomes compact at 1.4 GHz, but clearly has a resolved morphology at 10 GHz. The morphology at 10 GHz is inversion symmetric, and the 1.4 GHz emission shows excess radio luminosity over SF predictors, likely indicating that this is a radio AGN with a bipolar jet. The spectral index is steep, with . The broadband radio spectrum is not well fit by either a simple or curved power law. This is likely because we are probing two separate electron populations producing the observed radio emission. The 144 MHz emission probed by LoTSS is most probably associated with SNRs, while at GHz frequencies the radio AGN is the dominant emission component.


Figure A10. Intensity maps and contour overlays, and Pan-STARRS r-band image of the host galaxy of J1041+2953. The synthesized beam is shown in the bottom-left corner for the radio surveys, and a scale bar is shown in the bottom-right corner. Contours are shown at −3, 3, and 5, and increase by a factor of 2 thereafter times the nominal image rms for LoTSS, FIRST, and VLASS, and the off-source rms for the VLA X (12 μJy) panel. The Pan-STARRS image has been resampled and falsely colored to emphasize the tidal features of the host galaxy.
Download figure:
Standard image High-resolution imageA.11. J1304+6520
J1304+6520 is a radio AGN hosted by a Seyfert AGN emission-line galaxy. The radio emission of J1304+2953 is resolved by LoTSS and at 10 GHz, and unresolved by NVSS and VLASS (Figure A11). Although the emission is resolved by LoTSS, we find no evidence for emission coincident with the tidal features of the host galaxy. J1304+6520 is one of two radio sources at any frequency that is considered radio loud (ν Lν > 1032 W). Indeed, the 1.4 GHz luminosity of J1304+6520 is 3σ greater than what is expected by SF predictors, indicating this is a radio AGN. However, the morphology at 10 GHz is unexpected for a radio AGN as it does not resolve into the standard bipolar or one-sided jet morphology, or show a single, unresolved core. Different weighting schemes during imaging neither showed this jet-like morphology nor resolved out some of the extended features we observed at 10 GHz. This is discussed further in Section 6.4.1. More observations at high angular resolution are needed to study its morphology. The spectral index is steep, with . The broadband radio spectrum is not well fit by either a simple or curved power law. Although the reduced χ2 value for the simple power-law fit is not extremely poor, visual inspection of this fit to the broadband spectrum clearly shows deviant behavior. As with other sources showing this spectral behavior, this is most likely from two different electron populations being probed at 144 MHz and GHz frequencies, respectively.


Figure A11. Intensity maps and contour overlays, and Pan-STARRS r-band image of the host galaxy of J1304+6520. The synthesized beam is shown in the bottom-left corner for the radio surveys, and a scale bar is shown in the bottom-right corner except for NVSS, where it is in the upper-right corner. Contours are shown at –3, 3, and 5, and increase by a factor of 2 thereafter times the nominal image rms for LoTSS, NVSS, and VLASS, and the off-source rms for the VLA X (12 μJy) panel. The Pan-STARRS image has been resampled and falsely colored to emphasize the tidal features of the host galaxy.
Download figure:
Standard image High-resolution imageA.12. J1433+3444
J1433+3444 is a radio AGN hosted by a LINER emission-line galaxy. J1433+3444 displays the most AGN-like radio morphology of all sources detected by LoTSS (Figure A12). The 144 MHz morphology extends approximately 80'' (55 kpc at z = 0.034) at a PA of −39.3° in a one-sided, FRI-like structure, with possible deboosted, counter-jet emission. The base of this FRI-like jet is located approximately 9.1'' (6.2 kpc) to the southwest of the compact emission feature, but there is no evidence for jet bending or curvature that may explain this offset. The core is also marginally extended at an approximate PA of 24°, parallel to the tidal structure visible in the host galaxy's morphology extending to the northeast. The source is marginally resolved by FIRST and at 10 GHz, and resolved by VLASS. The VLASS contour map shows a marginal extension to the east. This feature also appears in the naturally weighted 10 GHz map, but appears to resolve into smaller components in a uniformally weighted map. We do note, however, that the ratio of peak to integrated 10 GHz flux density for this source is unity within 3σ, hence our morphological classification as marginally resolved. The spectral index is flat, with . The broadband radio spectrum is well fit by a curved power law but does not exhibit significant curvature (q = 0.08 ± 0.02).


Figure A12. Intensity maps and contour overlays, and Pan-STARRS r-band image of the host galaxy of J1433+3444. The synthesized beam is shown in the bottom-left corner for the radio surveys, and a scale bar is shown in the bottom-right corner. Contours are shown at −3, 3, and 5, and increase by a factor of 2 thereafter times the nominal image rms for RACS, FIRST, and VLASS, and the off-source rms for the VLA X (12 μJy) panel. The Pan-STARRS image has been resampled and falsely colored to emphasize the tidal features of the host galaxy. The LoTSS panel is in size to show the full extent of the FRI-like morphology.

Download figure:
Standard image High-resolution imageA.13. J1445+5134
J1445+5134 is a star-formation-dominated radio source hosted by a SF-AGN composite emission-line galaxy. The radio emission is resolved by LoTSS and at 3 GHz, unresolved by FIRST, and marginally resolved at 10 GHz (Figure A13). The extended components in the LoTSS map are not spatially coincident with any of the tidal features visible in the host galaxy's morphology. Even though the GHz-frequency radio emission is star-formation-dominated, the diffuse, host-galaxy-like morphology that is standard for such sources is not observed in J1445+5134. The spectral index is steep, with . The broadband radio spectrum is well fit by a curved power law, and shows evidence of curvature (q = −0.18 ± 0.02) with a peak frequency at 155 MHz.


Figure A13. Intensity maps and contour overlays, and Pan-STARRS r-band image of the host galaxy of J1445+5134. The synthesized beam is shown in the bottom-left corner for the radio surveys, and a scale bar is shown in the bottom-right corner. Contours are shown at −3, 3, and 5, and increase by a factor of 2 thereafter times the nominal image rms for LoTSS and FIRST, and the off-source rms for the VLA S (45 μJy) and VLA X (40 μJy) panels. The Pan-STARRS image has been resampled and falsely colored to emphasize the tidal features of the host galaxy. The VLA X panel is 3'' × 3'' in size.
Download figure:
Standard image High-resolution imageA.14. J1511+0417
J1511+0417 is a radio AGN hosted by a LINER emission-line galaxy. The radio emission is marginally resolved by FIRST, has multiple components at 3 and 10 GHz, and is a nondetection by RACS (Figure A14). Like J0206−0017 and J1041+1105, the local image rms in RACS (≈770 μJy) for J1511+0417 is significantly higher than the nominal survey rms (250 μJy), leading to a misinformed, apparent 5σ detection in Figure A14. We have not included this as a detection, as this emission is below a 3σ detection threshold using the local image rms, nor is it listed in the RACS catalog. The maps at 3 and 10 GHz show that this source has two components that are separated by 25 (2.1 kpc at z = 0.042). The southern, dominant component is unresolved at both frequencies and has an inverted spectral index value of . The northern component is marginally resolved at 3 GHz and is resolved at 10 GHz, and has a steep spectral index value of . It is particularly noteworthy that both radio sources are cospatial with distinct optical nuclei of the host galaxy (see inset of the Pan-STARRS panel in Figure A14). This makes J1511+0417 a candidate DAGN.


Figure A14. Intensity maps and contour overlays, and Pan-STARRS r-band image of the host galaxy of J1511+0417. The synthesized beam is shown in the bottom-left corner for the radio surveys, and a scale bar is shown in the bottom-right corner. Contours are shown at −3, 3, and 5, and increase by a factor of 2 thereafter times the nominal image rms for RACS and FIRST, and the off-source rms for the VLA S (12 μJy) and VLA X (7 μJy) panels. The Pan-STARRS image has been resampled and falsely colored to emphasize the tidal features of the host galaxy. The inset panel shows the dual nuclei of the host galaxy. The VLA X panel is 10'' × 10'' in size to show the second radio component. The local image rms of this RACS field is greater than the nominal image rms of RACS. Thus, the morphology of J1511+0417's 888 MHz emission is not represented accurately here.
Download figure:
Standard image High-resolution imageA.15. J1511+2309
J1511+2309 is a radio AGN hosted by an optically quiescent emission-line galaxy. The radio emission is resolved by RACS and at 10 GHz, shows multiple components in FIRST, and is marginally resolved at 3 GHz (Figure A15). At 888 MHz (RACS), the source is extended in a north–south direction, with a marginal extension in the east–west direction. The synthesized beam of RACS is too large (25'') to study if these extended features are associated with any tidal structures visible in the host galaxy. The emission then becomes compact at higher frequency until it displays a similar northern extension at 10 GHz. The spectral index is steep, with . The broadband radio spectrum is well fit by a curved power law and shows evidence of inversion (q = 1.61 ± 0.36). However, we believe that the spectrum likely is not truly inverted but is flattening at higher frequency, similar to J0206−0017. Higher-frequency observations are needed to confirm this.


Figure A15. Intensity maps and contour overlays, and Pan-STARRS r-band image of the host galaxy of J1511+2309. The synthesized beam is shown in the bottom-left corner for the radio surveys, and a scale bar is shown in the bottom-right corner. Contours are shown at −3, 3, and 5, and increase by a factor of 2 thereafter times the nominal image rms for RACS and FIRST, and the off-source rms for the VLA S (28 μJy) and VLA X (17 μJy) panels. The Pan-STARRS image has been resampled and falsely colored to emphasize the tidal features of the host galaxy.
Download figure:
Standard image High-resolution imageA.16. J1517+0409
J1517+0409 is a radio AGN hosted by an optically quiescent emission-line galaxy. It is unresolved at 3 GHz, and marginally resolved at 10 GHz (Figure A16). We found no evidence for emission at a significance of 3σ or greater in the RACS and FIRST maps centered on the 10 GHz position. Because it is a nondetection at 1.4 GHz, the radio-based SFR we calculated in Section 6.1 is an upper limit. Given this and the 3σ detection at 3 GHz, it is likely that its radio spectrum is peaking around 3 GHz. This requires an AGN origin for sustained high injection energy. The spectral index is steep, with . Although it is likely the radio spectrum is curved, robust detections at multiple frequencies are needed to confirm this.


Figure A16. Intensity maps and contour overlays, and Pan-STARRS r-band image of the host galaxy of J1517+0409. The synthesized beam is shown in the bottom-left corner for the radio surveys, and a scale bar is shown in the bottom-right corner. Contours are shown at −3, 3, and 5, and increase by a factor of 2 thereafter times the nominal image rms for RACS, FIRST, and VLASS, and the off-source rms for the VLA X (12 μJy) panel. The Pan-STARRS image has been resampled and falsely colored to emphasize the tidal features of the host galaxy.
Download figure:
Standard image High-resolution imageA.17. J1617+2512
J1617+2512 is a radio AGN hosted by a SF-AGN composite emission-line galaxy. The source is marginally resolved by RACS and FIRST, and resolved by VLASS and at 10 GHz (Figure A17). The RACS emission is generally diffuse, but the synthesized beam is too large (25'') to confidently assess if this diffuse nature is spatially coincident with the tidal features visible in the host galaxy. The source is extended to the southwest in the VLASS map, and marginally extended along a roughly northwest–southeast direction at 10 GHz. The spectral index is steep, with . The broadband radio spectrum is well fit by a curved power law and shows evidence of curvature (q = −0.37 ± 0.08), and has a peak frequency at 1.11 GHz, providing corroboratory evidence of its AGN nature.


Figure A17. Intensity maps and contour overlays, and Pan-STARRS r-band image of the host galaxy of J1617+2512. The synthesized beam is shown in the bottom-left corner for the radio surveys, and a scale bar is shown in the bottom-right corner. Contours are shown at −3, 3, and 5, and increase by a factor of 2 thereafter times the nominal image rms for RACS, FIRST, and VLASS, and the off-source rms for the VLA X (11 μJy) panel. The Pan-STARRS image has been resampled and falsely colored to emphasize the tidal features of the host galaxy.
Download figure:
Standard image High-resolution imageA.18. J1655+2639
J1655+2639 is a radio AGN hosted by an optically quiescent emission-line galaxy. The source is marginally resolved by RACS and FIRST, and resolved at 3 and 10 GHz (Figure A18). The 888 MHz emission is extended along the eastern and southern tidal features visible in the host galaxy. These 888 MHz features are slightly exaggerated in Figure A18, as the image was produced assuming the nominal image rms for RACS of 250 μJy, but the local image rms is actually ≈500 μJy The 1.4 GHz emission is also extended along the eastern tidal feature, although the dominant component to the radio emission is compact. Our observations at 3 and 10 GHz show the jet-like morphology of this radio AGN at a PA of ≈140°. The radio excess (>3σ) and morphology of this source make it among the clearest examples of a radio AGN in our sample. The spectral index is steep, with . The broadband radio spectrum is well fit by a simple power law.


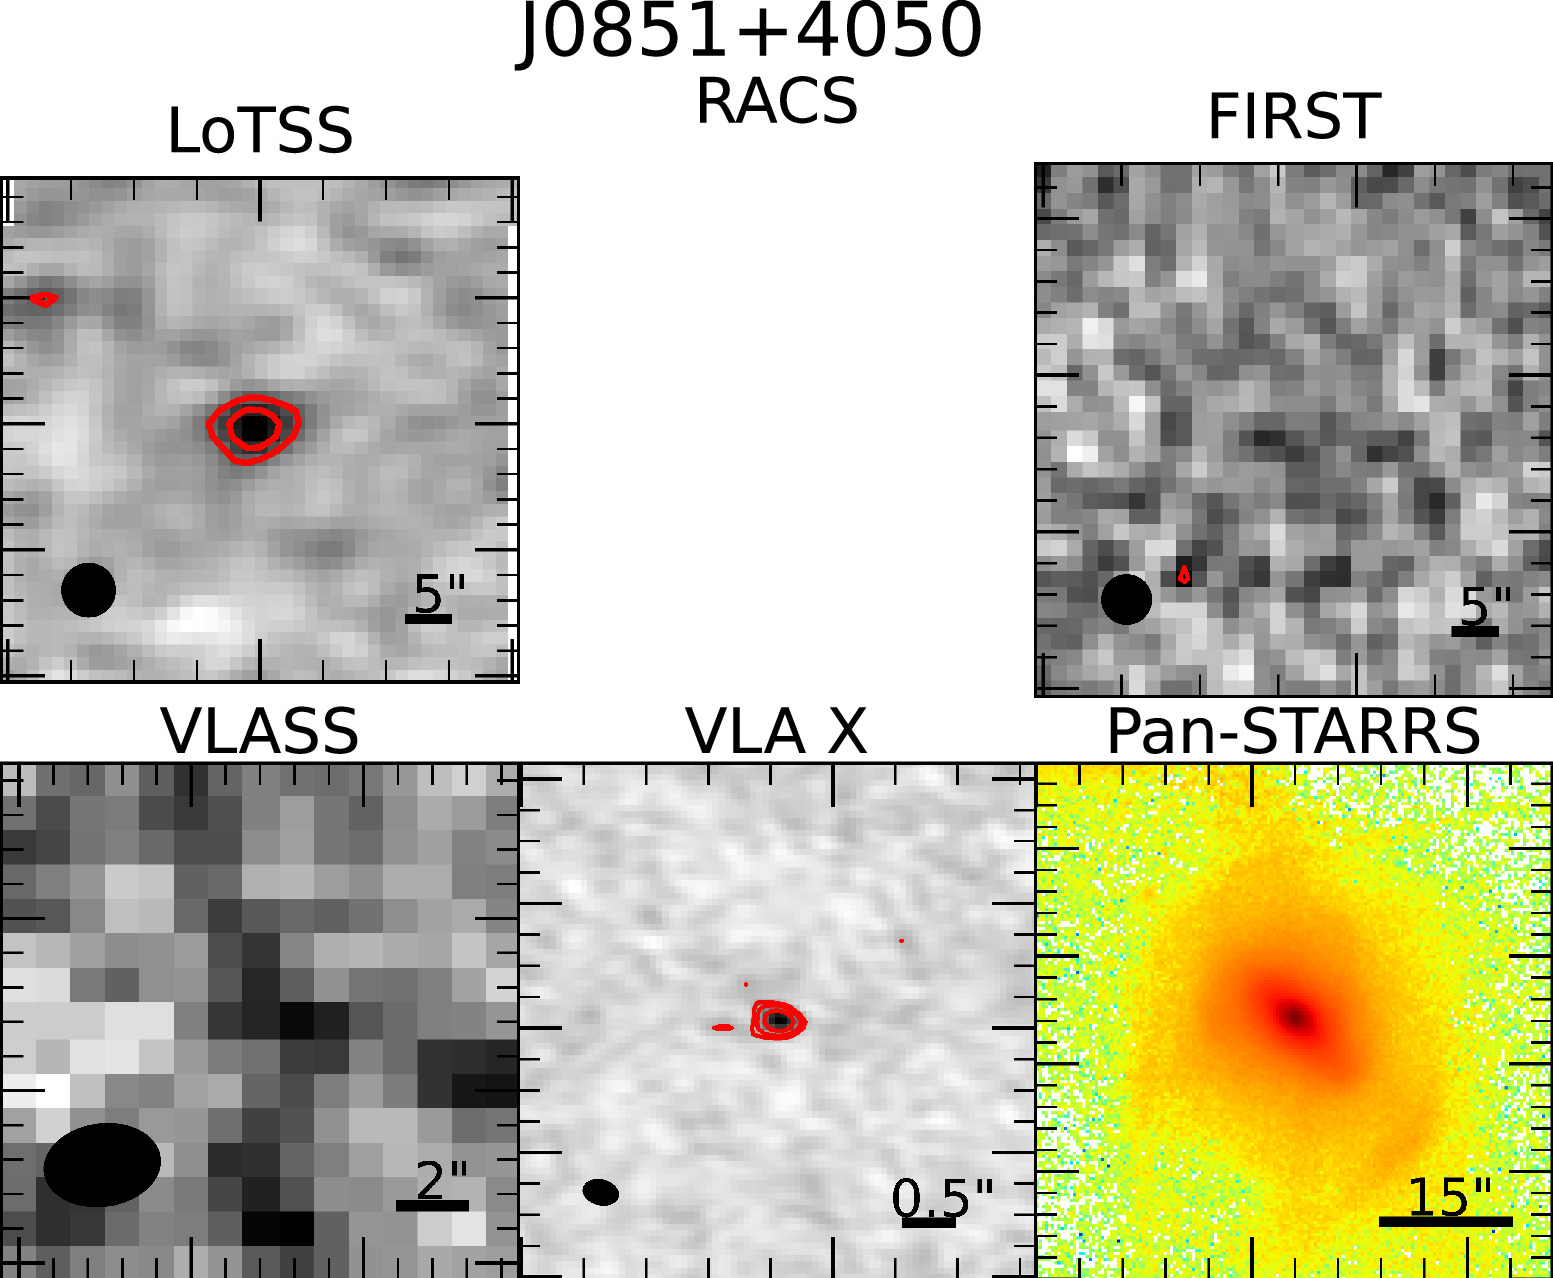
Figure A18. Intensity maps and contour overlays, and Pan-STARRS r-band image of the host galaxy of J1655+2639. The synthesized beam is shown in the bottom-left corner for the radio surveys, and a scale bar is shown in the bottom-right corner. Contours are shown at −3, 3, and 5, and increase by a factor of 2 thereafter times the nominal image rms for RACS and FIRST, and the off-source rms for the VLA S (34 μJy) and VLA X (19 μJy) panels. The Pan-STARRS image has been resampled and falsely colored to emphasize the tidal features of the host galaxy.
Download figure:
Standard image High-resolution image
Footnotes
- 3
- 4
- 5
- 6
- 7
- 8
- 9