1.
Introduction
With the shortage of natural resources and the continuous deterioration of ecological environment, circular economy has attracted more and more attention from all walks of life [1]. As an important part of the closed-loop supply chain system in the circular economy, recycling and remanufacturing activities can not only realize the efficient utilization of resources, but also reduce the adverse effects of waste pollution and over exploitation of resources [2]. Moreover, remanufacturing production, if properly handled, can decrease production cost, enhance productivity efficiency, and effectively improve the competitive advantage of enterprises [3]. However, closed loop supply chain management is more complex and there are still many challenges, for instance, how could enterprises make optimal decisions under uncertain environment and how could government formulates reasonable subsidy allocation policy to enhance enterprises' green investment level and the implementation effect of recycling and remanufacturing [4].
Major uncertainty factors such as market demand, recovery quality, recycling rate, green level of recycled products, and buyback and remanufacturing costs, make green closed loop supply chain management more sophisticated and add more difficulties for enterprises to make recycling, production, and sales decisions [5]. Disturbances in market demand greatly affect production operation [6]. Uncertain recovery quality simultaneously affects recycling rate, buyback and remanufacturing costs, and green level of recycled products [7]. Therefore, demand and recovery quality are more important uncertainty factors. Wang et al. [8] regarded uncertain demand and manufacturing cost as fuzzy variables and analyzed optimal pricing policies considering green investment and sales effort. Li et al. [9] took random demand into consideration and established a theoretical model in which the remanufacturer plays as a leader and the recycler acts as a follower. Dai et al. [10] considered a dual-channel supply chain composed of a manufacturer and a retailer in which each member obtains heterogeneous forecasting information about uncertain demand. Zhu et al. [11] optimized decisions for hierarchical industrial status of the SME, CE and CB under the uncertainties of market demand. Zeballos et al. [12] proposed a scenario-based stochastic mixed-integer programming model considering uncertain recovery quality. Jeihoonian et al. [13] designed a closed-loop supply chain network under uncertain quality status with a case of durable products. Heydari et al. [14] investigated a two-echelon reverse supply chain considering uncertain recovered quality that follows a uniform distribution. The above studies separately analyzed uncertain market demand or recovery quality. However, in reality, market demand is often divided into new products demand and remanufactured products demand [15], moreover, for enterprises, the proportion of new products and remanufactured products is related to the quality of recycled products. Based on above analysis, this paper simultaneously discusses uncertain market demand (new products and remanufactured products demand) and recovery quality.
Stochastic programming, robust optimization, and fuzzy chance constrained programming are currently used methods to solve the uncertainty problem in closed-loop supply chain. Ghelichi et al. [16] established a two-stage stochastic programming model for the design of an integrated green biodiesel supply chain network from Jatropha Curcas feedstocks, and a flexible stochastic programming approach was developed and applied to the supply chain network model. Farrokh et al. [17] used robust optimization to solve the problem of uncertain demand and studied the impact of uncertain demand on net profit. Ahmadi et al. [18] established a multi-objective mixed integer linear programming model considering uncertain requirements and adopted the fuzzy chance constraint programming method to solve uncertain problems. Josefa et al. [19] compared stochastic programming with fuzzy chance-constrained programming to solve the problem of uncertain demand and concluded that fuzzy chance-constrained programming is easier to obtain the optimal solution. Lima et al. [20] used a fuzzy programming approach to design and plan the downstream oil supply chain under uncertainty. Ziya-Gorabi et al. [21] used fuzzy chance constrained programming to solve and optimize the problem of a mixed-integer linear programming (MILP) model with three objectives in both definite and indefinite states. By comparing the three methods, it can be found that stochastic programming can solve uncertain problems relatively accurately, but it requires enough statistical data and is too complicated to solve multi-scene problems [19]. Robust optimization can effectively deal with the changes of fuzzy parameters, but too much emphasis on confidence level will lead to conservative results [22]. Relatively speaking, fuzzy chance constraint programming can not only solve the problem of lack of accurate values, but also constrain confidence level according to the attitude of decision-makers, and avoid overly conservative results, thus making the model flexible, and more in line with the actual situation of enterprise decision-making [23]. In this paper, fuzzy chance-constrained programming is thus used to solve the demand uncertainty problem of both new products and remanufactured products.
The purpose of building a green supply chain is to pursue both economic benefits and green benefits, that is, environmental benefits, so as to achieve the sustainable development of society. At present, enterprises pay attention not only to their competitiveness but also to their social image [24]. In recent years, many scholars have conducted extensive research on consumers' green preference behavior. Jian et al. [25] designed a green closed-loop supply chain with profit sharing contract coordination fairness. Liu et al. [26] optimized the network's worst-case performance based on a trade-off between upside risk and economic cost expectations in a green closed-loop supply chain. Asghari et al. [27] examined a single-stage green closed-loop supply chain (GCLSC) in which the green manufacturer, retailer, and collector try to reform the environmental effects of their operations, products, and services across the value chain according to their environmental responsibilities. The above research only involve the study of green preference behavior, but this paper intends to take greenness as a parameter to specifically study the relationship between total profit, weighted subsidy and greenness level.
Corporate Environmental Responsibility (CER) can not only enhance economic benefits and improve corporate image, but has a practical significance for environmental protection [28]. Moreover, consumers' preference for environmentally friendly products can bring unique competitive advantages for enterprises [29]. Marchi et al. [30] found that CER played a strategic role in closed loop supply chain management. Huang et al. [31] explored the impact of carbon policy and environmental responsibility investment on the integrated inventory. Hong et al. [32] considered stakeholders' environmental responsibilities in a two-echelon supply chain in which a manufacturer designed and produced green products. Cheng et al. [33] established six game models considering environmental protection responsibility in order to address the optimal power structure problem. Han et al. [34] constructed an environmental responsibility improved input-output measurement model of corporate energy consumption and pollution discharge in industrial parks. Yang et al. [35] employed game models of a sustainable supply chain, considering environmental responsibilities under different channel leaderships. The above studies discussed the impact of corporate environmental responsibility on the optimal decision in a single cycle closed loop supply chain production. However, in real production activities, manufacturing and remanufacturing production is often carried out in multiple cycles [36]. Therefore, this paper studied CER through green investment in the multi-cycle closed loop supply chain.
Government subsidies play an important role in encouraging enterprises to make green investment and improving the implementation effect of recycling and remanufacturing [37]. Zheng et al. [38] discussed the impact of government subsidies on technological improvement and market demand and concluded that government's subsidies to manufacturers are beneficial to reduce technological improvement costs and expand green product market. Chen et al. [39] established an evolutionary game theory model based on carbon tax and subsidy, and studied the optimal decision of manufacturers under four different combinations of carbon tax and subsidy. Cohen et al. [40] studied the effect of subsidized consumers on production and pricing decisions in the context of demand uncertainty. Bian et al. [41] conducted a comparative study on the impact of subsidies to consumers and manufacturers on carbon emission reduction and social welfare. Deng et al. [42] studied the problem of optimal government-to-patient subsidy differential (G2P-SD) policy design. Wang et al. [43] analyzed the low-carbon decision of the construction supply chain under government subsidies with the help of differential game theory. Chen et al. [44] investigated the optimal production and subsidy rate of the supply chain considering consumer environmental awareness. In the above literature, subsidies to manufacturers and consumers were discussed separately, the unit total subsidy is fixed, and also the influence of recycled product quality level on the subsidies is not considered. This paper studies the influence of the government's differential weight subsidies to manufacturers and consumers on the optimal decision-making of closed-loop supply chain, moreover, the government will consider the quality level of recycled products in the process of giving subsidies.
Incentive-compatibility theory makes both enterprises and government tend to maximize utility through incentive strategies [45]. Reasonable incentive mechanism formulated by government can effectively expand green product market, and increase recycling rate and economic benefits while guide enterprises to make a higher green investment level [46]. Wang et al. [47] investigated a couple of incentive mechanisms for collaboratively enhancing product greenness and found that the proposed incentive mechanisms can contribute to improve overall utility. Qu et al. [48] studied the incentive problems associated with inventory investment and found that incentive distortion arised when retailers had to allocate inventory over time. Wang et al. [49] regarded government subsidy as incentive mechanism and concluded that subsidy incentive could affect the synergetic development. Zhang et al. [50] found that only the tariffs incentive set by government and the values of environmental impact satisfied a three-dimensional area, can two competitive firms ensure a stable market. Guo et al. [51] examines notions of incentive-compatibility in an environment with ambiguity-averse agents. Barberà et al. [52] proved that incentive-compatibility extends to groups, and that strategy-proofness implies strong group strategy-proofness in the special case of private values. Based on incentive-compatibility theory, this paper studies optimal subsidy allocation policy when both government and manufacturer tend to maximize utility considering government differential weighting subsidy for manufacturer and consumers purchasing remanufactured products.
Exact algorithm and meta-heuristic algorithm are often used to solve non-linear optimization issues with mixed integer variables. Among them, the exact algorithm can find the most accurate solution. In this paper, a classical accurate solution software, CPLEX is used to find the accurate solution of a calculating example of the model. Meta-heuristic algorithms are widely used to solve function optimization and discrete problems, such as monarch butterfly optimization (MBO), slime mould algorithm (SMA), moth search algorithm (MSA), hunger games search (HGS), Runge Kutta method (RKM), colony predation algorithm (CPA), Harris hawks optimization (HHO), and Genetic algorithm (GA). Feng et al. [53] found that MBO can outperform many state-of-the-art optimization techniques when solving global numerical optimization and engineering problems. In order to demonstrate the superior performance of the MBO algorithm, Wang et al. [54] carried out a comparative study with five other meta-heuristic algorithms through thirty-eight benchmark problems, and found that the MBO method is able to find the better function values on most benchmark problems as compared to five other meta-heuristic algorithms. Rahman et al. [55] used moth search algorithm (MSA) to optimize and validate the trade-off between the total cost of tardiness and batch delivery. Chouar et al. [56] investigated slime mould algorithm (SMA) to reduce cost in a PI-SCN hybrid framework based on an artificial neural network. Yang et al. [57] believed main feature of hunger games search is its dynamic nature, simple structure, and high performance in terms of convergence and acceptable quality of solutions. Nguyen et al. [58] introduced a novel and robust hybrid model for predicting BIGV based on the Hunger Games Search optimization algorithm (HGS) and ANN. Ambrosio et al. [59] provided a nonlinear stability analysis for a class of stochastic Runge-Kutta methods (RKM), applied to problems generating mean-square contractive solutions. Shi et al. [60] created an efficient intelligence method for the diagnosis of COVID-19 from the perspective of biochemical indexes, which is called the colony predation algorithm (CPA). Mashaleh et al. [61] presented a novel spam classification on email spam technique, which integrated the Harris Hawks optimizer (HHO) algorithm. The above research involve new algorithms in recent years, we can find the better function values on most benchmark problems as compared to other meta-heuristic algorithms. However, they are rarely used in closed-loop supply chain models at present.
Genetic algorithm (GA), as a heuristic random intelligent optimization algorithm to find the optimal solution through iteration, can process multiple individuals in the population at the same time, thus reducing the risk of falling into the local optimal solution. As a classical intelligent optimization algorithm, GA is widely used in function optimization and path optimization in the field of closed-loop supply chain [62]. Aiming at the carbon emission of e-commerce companies, Liu et al. [63] proposed GA to solve the joint design model of multi-cycle reverse logistics network. Sahebjamnia et al. [64] developed hybrid meta-heuristic algorithms, such as GA, Simulated Annealing (SA) and so on to improve the solution quality and decrease the computational time for solving the sustainable closed-loop tire supply chain network. Feng et al. [65] optimized BP neural network based on GA and PSO. Zhao et al. [66] carried out GA to validate the feasibility and applicability of emergency distribution route optimization for EV mobile power supply.
Considering that the main contribution of this paper is to establish a profit models of green closed loop supply chain system, the validity of the model is verified by numerical examples. In the past few years, GA has proved its good applicability and many papers also use GA as a reliable calculating method, by comparing the calculation results of CPLEX and GA in the small-scale case, the effectiveness of GA algorithm is verified in this paper.
Based on above analysis, this paper studies enterprises' optimal recovery, production and sales decisions under uncertain environments; and fatherly, based on incentive-compatibility, government's optimal subsidy allocation policy and enterprises' green investment level are also analyzed when both government and enterprises tend to maximize their utilities. This study could help enterprises make optimal decisions when faced with uncertain market demand and recovery quality, and also provide quantifiable suggestions for government to formulate reasonable subsidy allocation weight so as to effectively promote enterprises' enthusiasm for green investment and encourage enterprises to engage in recycling and remanufacturing. The comparison between the above literature and this study is shown in Table 1.
The uniqueness and contributions of this paper are listed below:
(1) Incentive-compatibility theory is proposed to construct a green closed-loop supply chain model.
(2) The proposed green closed-loop supply chain model can solve the problem of optimal operation of remanufacturing enterprises under uncertain environments of market demands and quality level of recycled products.
(3) Two profit models of green closed loop supply chain system are constructed under no government subsidy and government differential weight subsidy considering CER.
(4) Quantified subsidy for government and green investment level for enterprises are provided.
The remainder of this paper is organized as follows: problem definitions, assumptions, and notations are stated in Section 2. Section 3 provides a derivation of the established models. Section 4 introduces solution techniques GA and CPLEX. The computational results, sensitivity analysis and managerial insights are rendered in Section 5. Finally, key conclusions of this study and potential future extensions are rendered in Section 6.
2.
Problem definitions, notations, and assumptions
2.1. Problem definitions
Two gross profit models of green closed loop supply chain system were constructed under no government subsidy and government differential weight subsidy considering CER and incentive-compatibility respectively. This paper mainly deals with the following questions:
(1) How do uncertain demands of new products and remanufactured products affect manufacturers' optimal recycling, production, and sales decisions in the green closed loop supply chain?
(2) In the case of considering CER alone without government subsidy, how can green investment level affect gross profit, recycled products greenness, recycling rate, and manufacturer's enthusiasm for green investment?
(3) In the case of considering CER and government differential weighting subsidy, based on incentive-compatibility theory, how can government set a reasonable subsidy allocation weight to effectively incent manufacturer to set a higher green investment level, so as to achieve the effect of incentive-compatibility and the purpose of environmental protection?
2.2. Notations
To model the green closed loop supply chain system (GCL-SCS), the following notations are introduced.
2.2.1. Input parameters
2.2.2. Output parameters
2.2.3. Decision variables
2.3. Assumptions
To model the green closed loop supply chain system, the following assumptions are introduced.
(1) The quality level of returned used products obeys standard normal distribution [67].
(2) Raw materials are purchased only once in a cycle [68].
(3) All recycled products are remanufactured [69], because there is a minimum quality level required for product recycling [70].
(4) Take no account of lead time, out of stock or surplus [68].
(5) Recycled products greenness is proportional to the recovery quality level: g=σq [71].
(6) Government subsidies manufacturers and consumers buying remanufacturing products with different allocation weights [72].The allocation weight for consumers is w, and the corresponding allocation weight for manufacturer is 1−w.
(7) Market demand for new products is Dn=αn−τ1pn+τ2pr−μ√wr+l√e, market demand for remanufacturing products is Dr=αr−τ1pr+τ2pn+μ√wr+l√e, so the overall market demand is D=αn+αr+(τ2−τ1)(pn+pr)+2l√e [73,74].
3.
Mathematical modeling
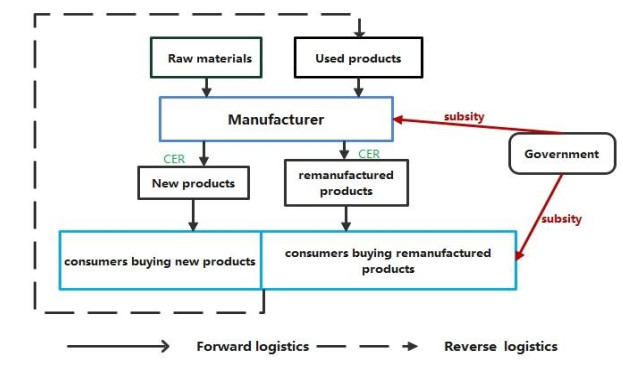
As can be seen in Figure 1, the green closed loop supply chain system consists of the following parts: (1) Manufacturer purchases raw materials for new products production and recycles used products from consumers for remanufacturing activities. (2) Manufacturer undertakes CER by adopting green technology investment for new products and remanufactured products. (3) Consumers buy new products or remanufactured products and recycle used products to manufacturer. (4) Government subsidies manufacturer and consumers buying remanufactured products aiming to enhance the green investment level and implementation effect of recycling and remanufacturing. The whole process forms a material cycle flow.
3.1. Cost of new products
3.1.1. Setup cost for manufacturing
At each cycle length T, manufacturing incurs a one-time production setup cost per unit time and it is given by:
V1 represents average setup cost for manufacturing.
3.1.2. Ordering cost
Order cost is the cost incurred to replenish stocks. Its function is given by:
V2 represents average ordering cost, and total ordering cost for T period is C0.
V2 represents average ordering cost, and total ordering cost for T period is C0.
3.1.3. Raw material holding cost
Raw material holding cost is the cost incurred to maintain raw materials. Its function is the following:
V3 represents average raw material holding cost, which equals to purchase quantity and unit cost of raw materials.
3.1.4. Manufacturing cost
Manufacturing cost is the cost for production activities. Its function is determined by:
V4 represents average manufacturing cost, which equals to manufacturing quantity and unit manufacturing cost.
3.1.5. Inventory costs of raw material and new products
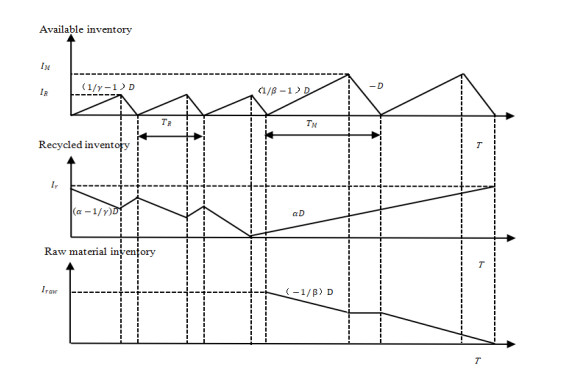
A period T is composed of n manufacturing periods Tn and m remanufacturing periods Tm. The inventory statuses are shown in Figure 2 [75].
Remanufacturing process is set before manufacturing process, because the value of recycled products decreases gradually with the shelving time in a short life cycle. Remanufacturing products inventory builds up at a rate of (1/γ−1)D units per unit of time and stops at its peak IR; recycled products inventory decreases at a rate of (α−1/γ)D. Then manufacturing process begins, new products inventory builds up at a rate of (1/β−1)D units per unit of time and stops at its peak IM; simultaneously, raw material inventory decreases at the rate of (1/β)D (as shown in Figure 2).
According to above analysis, the related formulas are listed below:
After simple deduction, the following can be gained:
Iraw is the maximum raw material inventory:
IM is the maximum new products inventory:
Then the inventory costs of raw material and new products V5 are:
3.2. Cost of remanufactured products
Recycled products, like raw materials, are deemed as a kind of production resource. If their price is higher than production cost, they will not be economically recycled. The quality level of recycled products can affect recycling rate, buyback, and remanufacturing cost.
Recycling rate d is related to the required minimum quality level of recycled products q. If we improve the required minimum quality level q, the recycling rate d will decrease, and vice versa. With a constant demand rate D, recycling rate is defined as:
Marginal recycling rate is the following [70]:
b and φ are parameters applied in different conditions.
Based on model assumptions, required minimum quality level q obeys standard normal distribution, q∼N(0.1), x is the quality level of recycled products, q<x<1. The probability density function is:
3.2.1. Setup cost for remanufacturing
At each cycle length T, remanufacturing incurs a one-time production setup cost per unit time and it is given by:
V6 represents average setup cost for remanufacturing.
3.2.2. Buyback cost
Buyback cost ratio p (related to different quality level x) is the ratio of unit buyback cost to unit production cost of new product (here production cost is defined as manufacturing cost Cn plus raw materials cost Craw). Buyback cost ratio is the following [70]:
Expected function of buyback cost ratio is:
Buyback cost function is determined by:
V7 represents average buyback cost, which consists of Cn, Craw, E(p), and d.
The reason why buyback cost is defined according to production cost is that recycled products are assumed to be a kind of raw materials. If we improve the required minimum quality level, the buyback cost will increase, and vice versa.
3.2.3. Remanufacturing cost
Similar to buyback cost function, remanufacturing cost ratio s (related to different quality level x) is the ratio of unit remanufacturing cost to unit manufacturing cost of new product. Remanufacturing cost ratio is the following [68]:
Expected function of remanufacturing cost ratio is the following [75]:
If we improve the required minimum quality level, the remanufacturing cost will decrease, and vice versa. Remanufacturing cost function is determined by:
V8 represents average remanufacturing cost, which consists of Cn, E(s), and d.
3.2.4. Inventory costs of recycled products and remanufacturing products
Ir is the maximum recycled products inventory:
IR is the maximum remanufacturing products inventory:
Then the inventory costs of recycled products and remanufacturing products V9 are: V9=12hsIRmTm1T+12hrIrT1T
3.3. Incentive-compatibility functions
Incentive-compatibility theory can avoid the agent to damage the principal's interests for their own benefits through various incentive strategies and ensure the agent act in accordance with the wishes of the principal, so that both parties tend to maximize their utilities [76].
According to above definition, incentive-compatibility theory consists of two parts: incentive and compatibility [77]. In this paper, the agent is set as manufacturer, and the principal is set as government. In order to undertake CER in production activities, manufacturer produces green products through green investment. In order to incent and guide manufacturer to set a higher green investment level, improve the implementation effect of recycling and remanufacturing, and achieve the purpose of environmental protection, government adopts differential weighting subsidy policy for manufacturer and consumers. Therefore, green investment is compatibility and government subsidy is incentive.
3.3.1. Incentive function
Government plays an important role in the formation and development of closed loop supply chain [78]. The operation of closed loop supply chain can be optimized and overall environmental benefits can be maximized by government subsidy incentive [72].
Government implements differential weight subsidy incentive for manufacturer and consumers purchasing remanufactured products according to model assumptions. With different quality levels of recycled products, the total subsidy amount for unit remanufactured product is r=prt(q−qs)/q [24]. The allocation weights for consumers and manufacturer are w and 1−w, so the total subsidy amount for manufacturer producing remanufactured products is:
The total subsidy amount for consumers purchasing remanufactured products is:
3.3.2. Compatibility function
Manufacturer undertakes corporate environmental responsibility and produces green products through green technology investment. Green investment cost is a convex function of investment level e. The average green investment cost is the following [79]:
3.4. Average gross profit
The average gross profit of the green closed loop supply chain system considering only CER without government subsidy is:
The average gross profit of the green closed loop supply chain system considering CER and government differential weight subsidy is:
3.5. Fuzzy chance constrained clarifications
Fuzzy Chance Constrained Programming (FCCP) is an uncertain mathematical programming method based on possibility theory and fuzzy set theory, which provides a powerful tool for solving uncertain problems [80]. Its main idea is to transform the fuzzy chance constraints into equivalent deterministic forms [81]. Fuzzy chance constrained programming is used to solve the problems of uncertain demand for new products and remanufactured products in this paper. The triangular fuzzy number of potential demand for new products and remanufactured products are defined respectively as dn=(dn1,dn2,dn3) and dr=(dr1,dr2,dr3). Their fuzzy membership functions are as follows:
According to the clear definition and lemma, we can get the following:
4.
Solution techniques
Based on the above analysis, the optimization task this model deals with is a non-linear optimization issue with mixed continuous/integer variables. Exact algorithms and meta-heuristic algorithm are often used to solve this kind of problems [82]. Among them, meta-heuristic algorithms always have faster operation speed, but the results of their solution are approximate optimal solution [83]; an exact algorithm can find the most accurate solution, but it always takes more time.
Among many meta-heuristic algorithms, GA is widely used because of its powerful global search ability [24]. Most researches use GA to obtain approximate optimal solutions for functional optimization, facility location, and vehicle routing optimization and so on [84]. Afzal et al. [85] used GA to solve a kind of function optimization problem. Guo et al. [24] verified the correlation model reliability by GA algorithm, and obtained approximate optimal solutions with high quality.
Based on this, CPLEX is used in this paper to find the optimal solution of the calculating example, and also the validity of the model is verified. However, when the calculation scale is large, the solution time of CPLEX is very long, or the solution cannot be obtained. Therefore, this paper also uses GA to find the approximate optimal solution. By comparing the calculation results of CPLEX and GA in a small-scale case, the effectiveness of GA algorithm is verified.
4.1. Genetic algorithm
As one of the evolutionary computation techniques, GA has been receiving great attention and successfully applied for combinatorial optimization problems, various integrated production, distribution planning problems and so on [62,86]). Genetic algorithm is an intelligent optimization algorithm based on genetic mechanism and natural selection, which can make the population continuously evolve through replication, crossover and mutation operations until the optimal solution is obtained [87,88].
The main operation steps of GA are as follows:
Step 1: Chromosome coding and initialization. In this paper, chromosome genes number is set as 6, maximum iteration number is set as 200, and population size is set as 50. Adopt binary coding to generate 0/1 initial population randomly, as shown in Table 2.
Step 2: Calculate fitness values. The fitness value of a chromosome reflects the probability of being selected. According to fitness function f(x)=object/1000 to calculate fitness value and object is the objective function equations (27) ~ (28) in this paper.
Step 3: Individual selection. Roulette wheel method is used for individual selection. The larger the objective function value is, the easier the chromosome is to be selected. Individual selection probability is:
Step 4: Crossover and variation. The process of crossover and mutation is shown in Table 3. In this paper, the crossover probability and mutation probability are set as 0.75 and 0.03.
Step 5: Stop condition. If the termination condition (maximum iteration number) is met, output the optimal solution is; otherwise, return to step 2.
5.
Numerical experiments
5.1. Numerical results
According to the actual situation of the manufacturing industry and relevant literature research, parameter values are set and shown in Table 4 [68,24,70].
5.1.1. Optimal decision under uncertain environment
In this paper, 10% range is used to assign values of 76%, 86% and 96% to j and k respectively, and Matlab software is used to write GA and CPLEX codes to solve calculation example comparatively. The difference ratio of optimal fitness value between GA and CPLEX is gap=|APGGA−APGCPLEX|/APGGA.
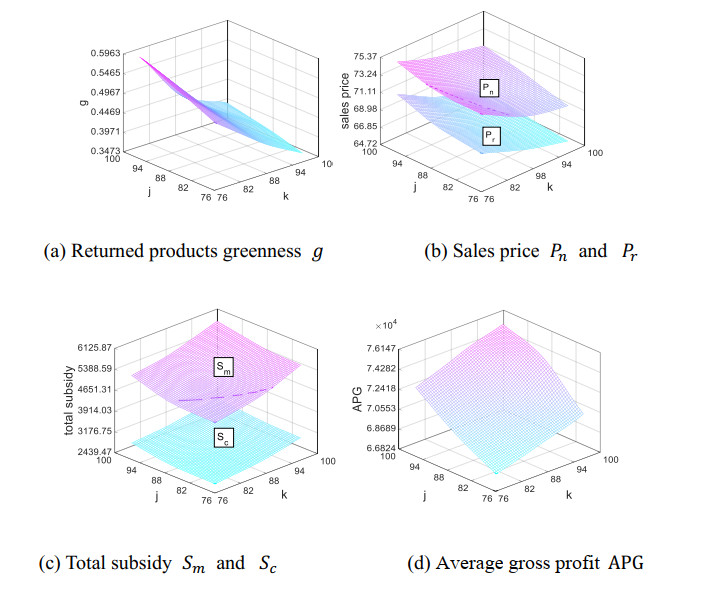
The calculation results are shown in Table 5 and Table 6. For further study optimal decisions under different confidence levels, the variation trend are shown in Figure 3 under the condition that j and k gradually increase from 76% to 96%.
It can be seen from Table 5 and Table 6 that:
(1) The maximum difference ratio between CPLEX and GA is 0.18%, which indicates that GA algorithm is not trapped into local optimal solution, thus verifying the proposed algorithm's validity and model's reliability. In this numerical example, when j and k are 96%, m is 3, n is 4, Pn and Pr are 72.08 and 66.74, the average gross profit APG reaches the maximum value 75452.63. At this moment, Sm and Sc are 5925.73 and 3190.78 respectively.
(2) By comparing the relationship between running time and the optimal solution, it is proved to have a certain accuracy and efficiency, so as to verify the validity of the algorithm and the credibility of the model.
(3) In actual enterprise production, enterprises often need to solve large-scale cost or profit problems, and expect to get a better cost or profit solution to reduce costs as soon as possible. However, if the scale of data is too large, CPLEX cannot find the feasible solution in reasonable time, which may cause the loss of its practical application value, therefore, the complementary solution of GA and CPLEX in this paper is more applicable.
It can be concluded from figure 3 that:
(1) When j is certain, as k increases gradually, g, Pn and Pr are decreasing; Sm, Sc and APG are increasing gradually. That is to say, when j is certain, with the increase of k, recycled products greenness decreases, sales price of new products and remanufactured products decreases, the subsidy amount for manufacturer and consumers gradually increases, and the average total profit increases gradually. That is because, with the increase of k, manufacturer's subsidy amount increases gradually, so the average total profit increases.
(2) When k is certain, as j increases gradually, g is increasing, Pn, Pr, Sm, Sc and APG is increasing gradually, that is to say, when k is certain, with the increase of j, recycled products greenness increases, sales prices of new products and remanufactured products increases, the subsidy amount for manufacturers and consumers increases, and the average total profit increases gradually. That is because, with the increase of j, average raw material procurement operating cost decreases gradually, so the average total profit increases.
(3) With the increase of k, enterprises should produce more remanufacturing products and increase economic benefits by increasing government subsidy. With the increase of j, enterprises should produce more new products and increase economic benefits by reducing raw material procurement cost. Enterprises can make optimal recycling, production, and sales decisions according to potential demand, and hence gradually increase the gross profit.
5.1.2. Optimal decision under no government subsidy
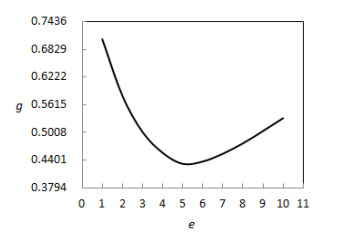
In the case of considering CER alone without government subsidy, we study the effect of green investment level on gross profit, recycled products greenness, recycling rate, and manufacturer's enthusiasm for green investment.
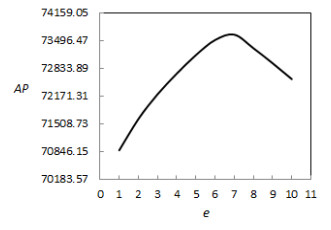
It can be concluded from figure 4 and figure 5 that:
(1) When e<6.9, as e increases, AP goes up gradually; However, when e>6.9, as e increases further, AP goes down instead. This is because, with the increase of e, green investment cost increases greatly, so AP decreases gradually.
(2) When e<5.3, as e increases, g goes down and d goes up gradually; However, when e>5.3, as e increases further, g goes up instead. This is because, the higher green investment cost pushes up the sales price, and the growth rate of market demand decreases brought by green investment, so g goes up instead.
(3) In the case of no government subsidy and only considering CER, a higher green investment level will make a decrease in average gross profit and recycling rate, and an increase in recycled products greenness, which leads to a lower green investment level and an insignificant effect on environmental protection.
5.1.3. Optimal decision under government differential weighting subsidy
In the case of considering CER and government differential weighting subsidy, based on incentive-compatibility theory, we study the reasonable subsidy allocation weight set by government to effectively incent manufacturer to set a higher green investment level, in order to achieve the effect of incentive-compatibility and the purpose of environmental protection.
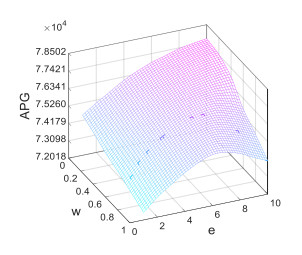
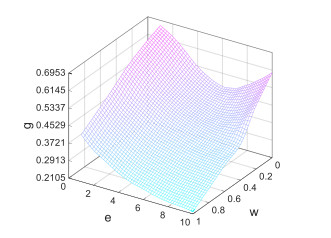
It can be concluded from figure 6 and figure 7 that:
(1) When 0<w<0.41, with the increase of e, APG increases gradually. Government subsidy has a positive effect on improving the green investment level of manufacturer, and the incentive effect is significant; However, when 0.41<w<1, with the increase of e, APG firstly goes up and then goes down. Although the optimal value of e is improved, the incentive effect is not high.
(2) When 0.34<w<1, with the increase of e, g decreases and d increases gradually. Manufacturer is incited to enhance the green investment level, and the market demand for green products is increased gradually. The incentive effect is significant; However, when 0<w<0.34, with the increase of e, g firstly goes down and then goes up, and d firstly goes up and then goes down. Although the optimal value of g decreases, the incentive effect is not high.
(3) Based on above analysis, government differential weighting subsidy can reduce the financial burden of enterprises' green investment and expand the market demand for green products. When government sets the subsidy weight for consumer as 0.34~0.41, with the increase of green investment level, average gross profit increases, recycled products greenness decreases, and recycling rate increases gradually, which continuously promotes enterprises to develop a higher green investment level, achieve the effect of incentive-compatibility and the purpose of environmental protection.
5.1.4. Effect comparison before and after incentive-compatibility theory
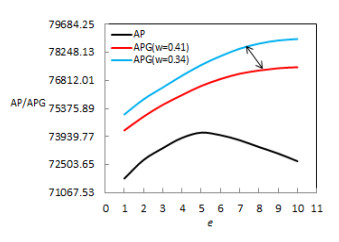
It can be concluded from figure 8 and figure 9 that:
(1) Based on incentive-compatibility theory, when government sets the subsidy weight for consumer as 0.34 < w < 0.41 (the corresponding subsidy weight for manufacturer as 0.59 < 1−w < 0.66).
(2) Compared with before the implementation of incentive-compatibility, with the increase of green investment level e, average gross profit APG increases, recycled products greenness g decreases, and recycling rate d increases gradually, which incite enterprises to continuously enhance the green investment level.
(3) Therefore, by formulating reasonable subsidy policies, the government can reduce the financial burden of enterprises' green investment and expand the market demand for green products.
5.2. Discussion (Managerial insights and main achievements)
Based on above calculating results and analysis, managerial insights are rendered as the following:
(1) Under uncertain environment, enterprises can adopt the following methods to optimize the green closed loop supply chain system (GCL-SCS):
● When the confidence level of potential demand for new products is certain, with the increase of confidence level of potential demand for remanufactured products, enterprise should recycle the used products with lower greenness, reduce the sales prices of new products and remanufactured products, and increase recycling rate and remanufacturing lot, so as to improve the gross profit.
● When the confidence level of potential demand for remanufactured products is certain, with the increase of the confidence level of potential demand for new products, enterprise should recycle the used products with higher greenness, increase the sales price of new products and remanufactured products, decrease recycling rate, and increase manufacturing lot, so as to improve the gross profit.
(2) In the case of only CER with no government subsidy, enterprises can optimize the green closed loop supply chain system by the following methods:
● In the case of only green investment, a higher green investment level will reduce the gross profit and recycling rate. Therefore, enterprises should set a lower level of green investment to avoid a higher green investment cost.
● In the case of only green investment, the optimal green investment level of the enterprise should be kept within a certain range, which is 5.3-6.9 in the calculating example of this paper.
(3) In the case of considering CER and government differential weighting subsidy, based on incentive-compatibility theory, government can optimize the green closed loop supply chain system by the following methods:
● With the increase of green investment level, recycled products' greenness decreases, recycling rate increases, and the average gross profit increases gradually. Through the formulation of reasonable subsidy system, the government can reduce the financial burden of enterprises' green investment. When the weight of government's subsidy to consumers and manufacturers is controlled within a certain range, which are 0.34-0.41 and 0.59-0.66 in the calculating example of this paper.
● By formulating the reasonable subsidy policy, government can expand the market demand for green products, incent and guide enterprises to develop a higher green investment level, improve the implementation effect of recycling and remanufacturing, and achieve the optimal effect of environmental protection.
The main achievements could be the following:
(1) Under uncertain environments of market demands and quality level of recycled products, two gross profit models of green closed loop supply chain system are constructed under no government subsidy and government differential weight subsidy considering CER.
(2) Guiding enterprises to make optimal recycling, production, and sales decisions when faced with uncertain environments.
(3) Based on incentive compatibility theory, this paper studies the optimal subsidy allocation policy and green investment level when both government and enterprises tended to maximize utility.
6.
Conclusions
Under uncertain environment of market demand and recovery quality, based on incentive-compatibility theory, this paper studies the optimal subsidy allocation policy and green investment level when both government and enterprises tend to maximize utility. FCCP method is used to solve the fuzzy constraint problem; GA and CPLEX are used to solve a calculating example's approximate optimal solution of the model in this paper.
From this research we can get the following results: (1) Different levels of potential demand will affect enterprises' optimal recycling, production, and sales decisions; (2) In the case of considering CER without government subsidy, enterprises' enthusiasm for green investment is low and environmental protection effect is not obvious; (3) In the case of considering CER and government differential weighting subsidy, based on incentive- compatibility theory, reasonable subsidy and green investment can reduce the financial burden of enterprises' green investment effectively, incent enterprises to set a higher green investment level continuously, improve recycling rate and gross profit, and hence make the green closed loop supply chain reach the optimal state.
This study can provide reference for enterprises to make optimal recycling, production, and sales decisions under uncertain environments and provide quantifiable suggestions for government to set reasonable subsidy level, so as to effectively promote enterprises' enthusiasm for green investment and improve the recycling rate and gross profit in the green closed loop supply chain.
Limitations and further research:
(1) Under uncertain environment, this paper only studies offline distribution channels. Further research can consider online and offline sales channels in the e-commerce environment.
(2) This paper focuses on the recycling and manufacturing/remanufacturing of green products. Further research can consider more activities such as transportation and storage.
(3) This paper assumes that product shortage and surplus are not taken into account. Further study can consider the effect of product shortage or surplus on the optimal decisions in green closed loop supply chain.
Acknowledgments
This research is supported by the National Natural Science Foundation, China (No. 71631007, 71471110), Shanghai Science and Technology Innovation Action Plan (No.16DZ1201402), Capacity Building Project of Shanghai Science and Technology Commission (No.16040501500), and Grant-in-Aid for Scientific Research (C) of Japan Society of Promotion of Science (JSPS) (19K12148).
Conflict of interest
The authors declare there is no conflict of interest.


 DownLoad: