
Prognostic value of left ventricular structure and strain in chronic kidney disease patients by cardiovascular magnetic resonance imaging: a retrospective study
Author and article information
Abstract
Background
Individuals suffering from chronic kidney disease (CKD) frequently face a heightened likelihood of experiencing cardiovascular complications, including heart failure and cardiac mortality. Cardiovascular magnetic resonance feature tracking (CMR-FT) is utilized to assess the micro-contraction function of the myocardium. The objective of this research is to explore the relationship between the left ventricular anatomy, myocardial strain, and the clinical outcomes in patients with CKD.
Methods
A total of 77 patients with late-stage CKD were enrolled in this retrospective study. They underwent cardiac magnetic resonance imaging and were followed up, with no history of significant cardiac diseases. The patients were divided into two groups: those with a left ventricular global longitudinal strain (LVGLS) ≥ −15.2% (n = 49) and those with LVGLS < −15.2% (n = 28). The clinical endpoints were defined as hospitalization for heart failure or all-cause mortality.
Results
Over an average observation period of 22 ± 9 months, 11 (14%) patients passed away and 30 (39%) were admitted to the hospital for heart failure, with eight encountering both incidents. Those with LVGLS ≥ −15.2% had markedly lower rates of event-free survival concerning heart failure admissions and overall mortality than their counterparts (log-rank P = 0.014). Cox multivariable analysis indicated that reduced LVGLS consistently predicted a higher likelihood of combined outcomes of heart failure admissions and total mortality (HR: 3.40, 95% CI [1.35–8.56], P = 0.009), even when factoring in age, diabetes, left atrial diameter, and left ventricular mass index (LVMI). However, the LVMI showed no significant correlation with the risk of heart failure admissions or overall mortality.
Conclusion
Compared to patients with LVGLS < −15.2%, CKD patients with LVGLS ≥ −15.2% have an increased risk of heart failure hospitalization and all-cause mortality. The prognostic role of LVMI in assessing CKD patients among the Asian population requires further investigation.
Cite this as
2024. Prognostic value of left ventricular structure and strain in chronic kidney disease patients by cardiovascular magnetic resonance imaging: a retrospective study. PeerJ 12:e17853 https://doi.org/10.7717/peerj.17853Main article text
Introduction
Patients with chronic kidney disease (CKD) often face a higher incidence of cardiovascular issues like left ventricular hypertrophy, heart failure, and cardiac mortality (Go et al., 2004). CKD contributes to fluid imbalance, electrolyte changes, and increased vascular pressure, leading to sodium and potassium elevation and hypertension, which in turn can cause left ventricular hypertrophy and diastolic dysfunction (Furuland et al., 2018; Luo et al., 2016). Additionally, CKD is associated with ongoing inflammation and oxidative stress, plus an overactive renin-angiotensin-aldosterone system, all contributing to left ventricular systolic dysfunction (Herzog et al., 2011). Echocardiography is crucial for assessing the cardiac structure and function in CKD patients, serving as a key diagnostic tool in clinical settings (Pressman et al., 2015; Hensen et al., 2018), despite its limitations such as operator dependence and poor reproducibility. Speckle-tracking echocardiography studies have consistently shown that CKD patients exhibit increased left ventricular mass and reduced myocardial strain, factors significantly linked to adverse cardiovascular outcomes such as cardiac death, heart failure hospitalization, and myocardial infarction (Pressman et al., 2015; Hensen et al., 2018; Sági et al., 2022). Cardiovascular magnetic resonance (CMR) is considered the “gold standard” for assessing ventricular structure and function (Lu et al., 2011). CMR is the top method for evaluating ventricular health but is underused in CKD due to its time and cost demands. CMR-feature tracking (CMR-FT) offers a feasible alternative for assessing myocardial function in CKD without needing contrast agents. Recent studies indicate that CMR-FT can provide critical prognostic data for heart diseases, such as dilated cardiomyopathy and cardiac amyloidosis (Gao et al., 2021; Geers et al., 2023). This research seeks to understand the connection between left ventricular structure, myocardial strain via CMR, and the combined outcomes of heart failure hospitalization and mortality in CKD patients.
Methods
Patient population
This single-center retrospective study selected patients diagnosed with CKD at our institution from January 2020 to October 2020. This retrospective study’s data collection received approval from Meizhou People’s Hospital Ethics Review Committee (No.2023-C-107), and obtained written informed consent from the patients. Inclusion criteria: Glomerular filtration rate (eGFR) was calculated using the CKD Epidemiology Collaboration (CKD-EPI) equation (Herzog et al., 2011), and all patients met the diagnostic criteria for chronic kidney disease and underwent cardiac magnetic resonance imaging. Exclusion criteria: Patients with coronary artery disease, other types of cardiomyopathy, severe cardiac valvular diseases, previous hospitalization for heart failure, concurrent arrhythmias, or those with poor image quality that precluded post-processing were excluded from the study. The maximum follow-up period was 30 months, with hospitalization for heart failure (HHF) and all-cause mortality as the composite endpoints. With an average follow-up duration of 22 ± 9 months. Preliminary screening identified 90 patients for inclusion in the study. Out of the 77 patients analyzed (13 lost to follow-up), there were 42 males and 35 females. Clinical data were sourced from electronic medical records, and venous blood samples for laboratory testing were taken 1–2 days before MRI scans.
CMR equipment and scanning protocol
Imaging was performed using a 3.0T MRI system (Skyra, Siemens, Germany), with patients connected to an electrocardiogram and instructed in breath-hold techniques prior to scanning. Standard steady-state free precession (SSFP) sequences captured the two-chamber, three-chamber, and four-chamber long-axis views, along with short-axis cine images encompassing the entire left ventricle. The scan parameters were: Repetition time (TR) 44 ms, echo time (TE) 1.4 ms, flip angle (FA) 52 degrees, field of view (FOV) 360 × 340 mm, acquisition matrix 256 × 192, and a slice thickness of eight mm for the left ventricular short-axis views. Gadolinium-based contrast agents were avoided to prevent the risk of nephrogenic systemic fibrosis in patients.
Image analysis and post-processing
The unprocessed images were integrated into the CVI42 (Circle Cardiovascular Imaging, Calgary, Canada) software for advanced post-processing analysis.
Left ventricular function analysis
The 3D-multiplane module of the CVI42 software was used to analyze the biventricular function. The software automatically outlined and manually adjusted (if necessary) the endocardial and epicardial contours (excluding papillary muscles) in the short-axis cine to obtain functional indices, The software automatically calculated cardiac functional indices, including but not limited to, left and right ventricular ejection fractions (EF), end-diastolic volume (EDV), end-systolic volume (ESV), and left ventricular mass index (LVMI). Additionally, the left ventricular end-diastolic/end-systolic diameters (LVEDD/LVESD), right ventricular end-diastolic/end-systolic diameters (RVEDD/RVESD), and left atrial/right atrial diameters (LAD/RAD) were all measured in accordance with literature standards, with repeated measurements taken and averaged (Lu et al., 2011; Truong et al., 2020).
Left ventricular myocardial strain analysis
Left ventricular myocardial strain was analyzed using the feature tracking module of CVI42 in the study cohort. Automated outlining of endocardial and epicardial contours was performed in the short-axis, long-axis, and four-chamber views of the left ventricle. The software initiates feature tracking analysis, proactively tracking information on myocardial motion deformation based on the changes in myocardial voxel during the cardiac cycle. It qualitatively and quantitatively reflects the overall myocardial strain function through bull’s-eye plots and various strain metrics. The software automatically calculates the main left ventricular strain parameters: global longitudinal strain (GLS), global circumferential strain (GCS), and global radial strain (GRS) (Taylor et al., 2015).
Followed-up
Patients underwent continuous follow-up via comprehensive collection of clinical medical records, which included both inpatient and outpatient records, augmented by telephonic follow-ups as required. Clinical endpoints were delineated as either HHF or all-cause mortality. The follow-up period was rigorously calculated, commencing from the date of the CMR assessment up to the occurrence of the first endpoint event.
Statistical analysis
Adhering to the benchmarks for LVGLS as stipulated in extant scholarly works (LVGLS <−15.2% or LVGLS ≥ −15.2%), participants were stratified into two cohorts for further statistical scrutiny (Hensen et al., 2018). The portrayal of continuous variables was executed through means ± standard deviations or medians accompanied by interquartile ranges (IQR), depending on the normalcy of their distribution, whereas categorical variables were delineated as proportions. Comparative analyses between the cohorts were conducted via t-tests and Mann–Whitney U tests for continuous variables, in addition to χ2 tests for categorical variables. The exploration of the linkage between diminished left ventricular systolic functionality (LVGLS ≥−15.2%) and the occurrence of endpoint events was facilitated through Kaplan–Meier survival analysis. To decipher the relationships between LVGLS and various covariates, both univariate and multivariate logistic regression analyses were deployed. The determinants impacting survival were scrutinized through Cox proportional hazards regression analysis. These statistical operations were performed using SPSS software, version 26.0 (IBM Corp., Armonk, NY, USA), setting the threshold for statistical significance at P < 0.05.
Results
The study included 77 patients diagnosed with end-stage CKD. The average age of the patients was 54 ± 14 years, and 45% of the participants were female. Of these, 73 patients were classified as stage 5 chronic kidney disease, while four patients were categorized as stage 4. Among the entire cohort, 71 individuals were non-smokers (92%), 31 had diabetes (40%), and 65 had hypertension (with no distinction made between primary and renal hypertension) (84%). Based on the grouping, there were 28 patients (36%) with LVGLS<−15.2%, while 49 patients (64%) had LVGLS ≥−15.2% (Fig. 1). Comparative analyses between groups indicated no statistically significant disparities in hypertension, diabetes, or smoking status. Laboratory assessments encompassing uric acid, serum calcium, high-density lipoprotein, albumin, and hemoglobin levels revealed no discernible differences between the groups (Table 1).
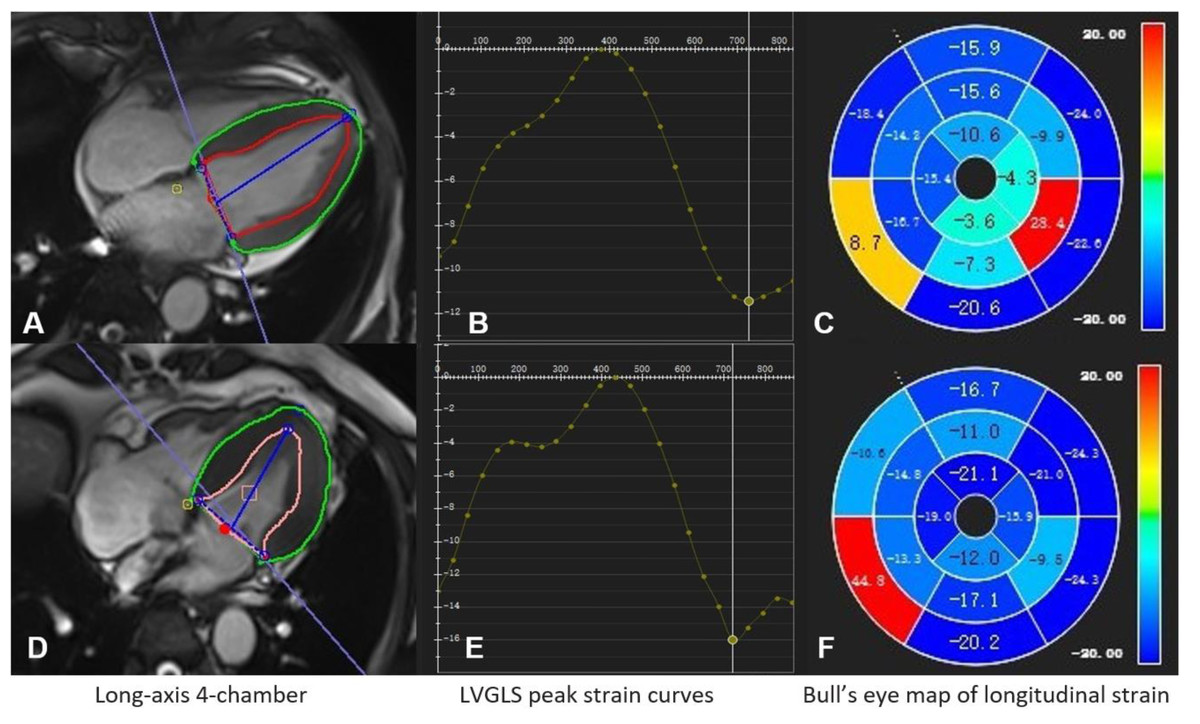
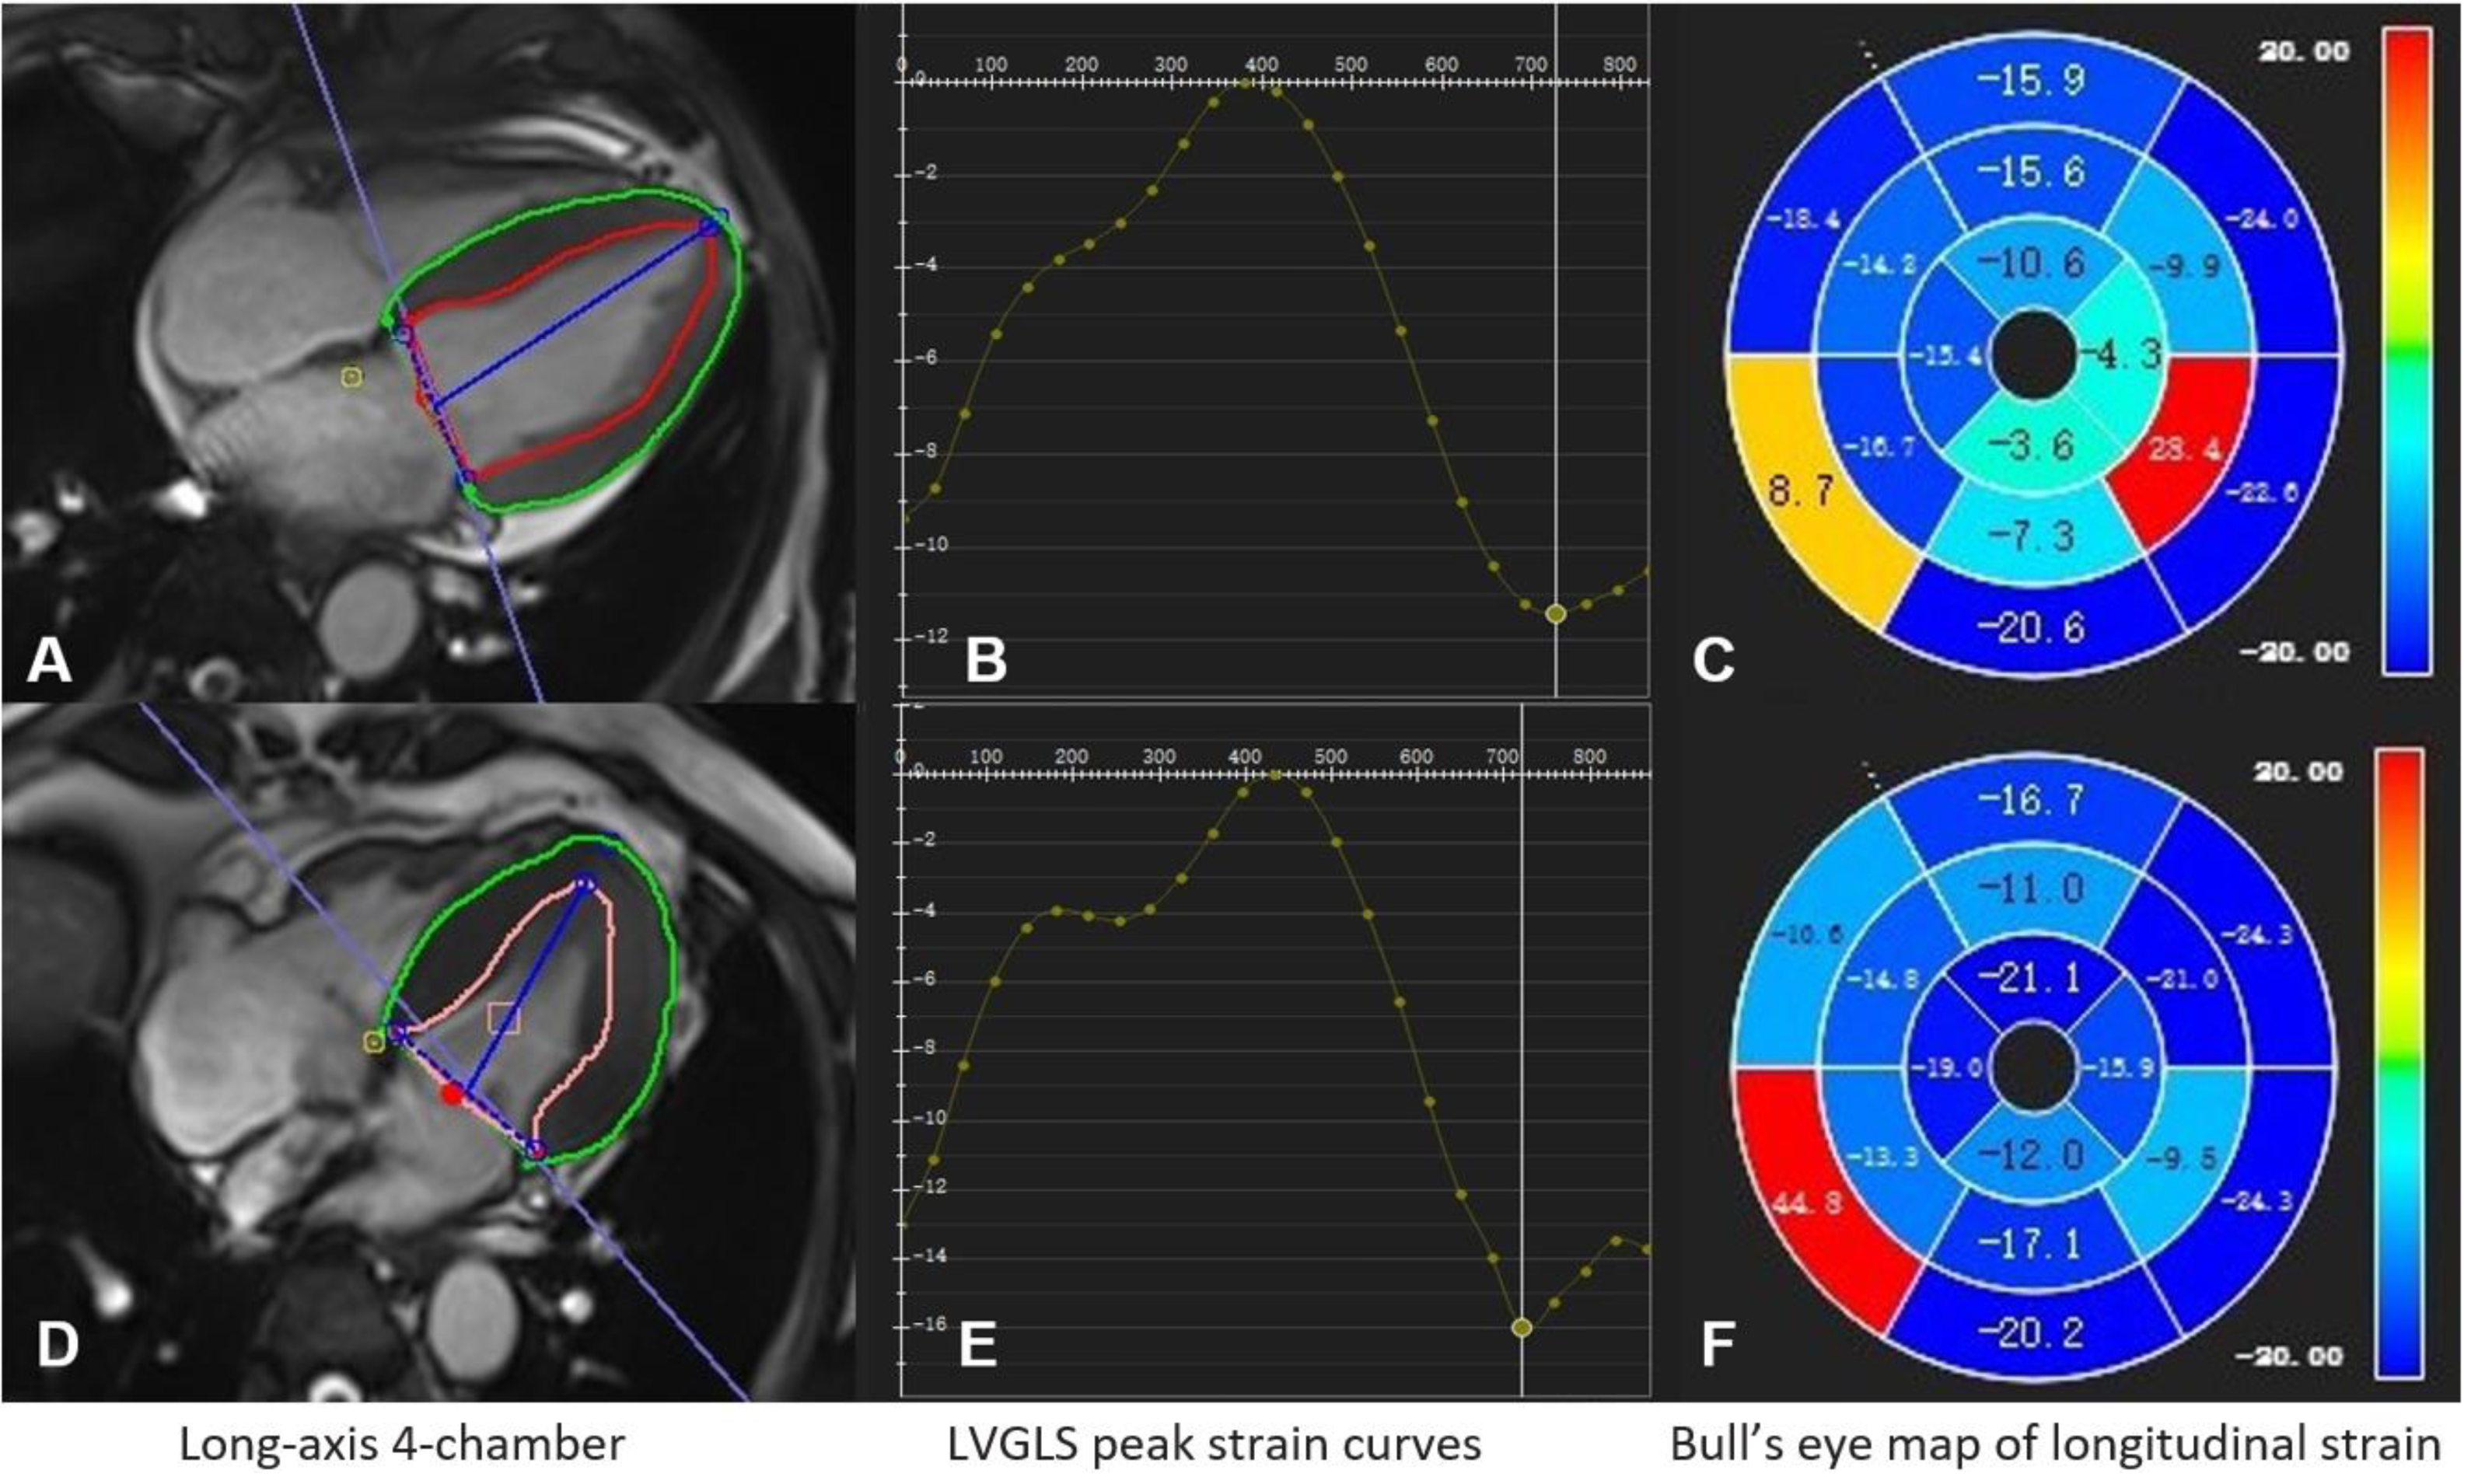
Figure 1: CMR-FT assessment of LV global longitudinal strain in CKD patients.
(A–C) A 60-year-old male with LVGLS of −11.4% who died at 10 months follow-up; (D–F) a 57-year-old male with LVGLS of −16.1% who had no endpoint events at 25 months follow-up.| Variable | LV GLS <-15.2 (n = 28) | LV GLS ≥-15.2 (n = 49) | P-value |
|---|---|---|---|
| Age (y) | 54.61 ± 14.51 | 54.35 ± 13.17 | 0.722 |
| HR (bpm) | 76.18 ± 13.11 | 83.22 ± 12.52 | 0.663 |
| Height (cm) | 160.71 ± 7.3 | 161.35 ± 8.54 | 0.141 |
| Weight (kg) | 60.14 ± 14.62 | 58.78 ± 11.23 | 0.637 |
| Sex (female) | 15(54%) | 20(41%) | 0.280 |
| Hypertension | 22(79%) | 43(88%) | 0.336 |
| Diabetes | 10(36%) | 21(43%) | 0.539 |
| Non-Smoker | 28(100%) | 43(88%) | 0.081 |
| BSA (m2) | 1.62 ± 0.19 | 1.61 ± 0.17 | 0.972 |
| UA (umol/L) | 458.24 ± 203.11 | 447.16 ± 168.35 | 0.118 |
| eGFR CKD-EPI (ml/min/1.73 m2) | 5.18(4.08–9.02) | 4.69(3.26–7.21) | 0.268 |
| Cr (umol/L) | 765.6(570.7–1099.73) | 854.1(597.4–1140.45) | 0.266 |
| BUN (mmol/L) | 23.08(14.09–32.24) | 20.04(15.1–28.71) | 0.485 |
| Cys-C (mg/L) | 4.6(3.91–5.65) | 5.08(3.87–6.12) | 0.732 |
| P (umol/L) | 1.95 ± 0.66 | 1.96 ± 0.65 | 0.612 |
| Ca (mmol/L) | 2.1(1.86–2.27) | 2.04(1.76–2.18) | 0.304 |
| TG (mmol/L) | 1.4(1.06–1.98) | 1.46(1.04–2.12) | 0.641 |
| CHOL (mmol/L) | 4.33(3.57–5.3) | 4.47(3.86–5.36) | 0.495 |
| HDL (mmol/L) | 1.19(0.99–1.44) | 1.09(0.96–1.52) | 0.478 |
| LDL (mmol/L) | 2.07(1.59–2.69) | 2.05(1.74–2.69) | 0.672 |
| HGB (g/L) | 87(75.75–106) | 83(69–104) | 0.415 |
| ALB (g/L) | 36.69 ± 7.54 | 33.58 ± 5.61 | 0.135 |
Notes:
- LV-GLS
-
left ventricular global longitudinal strain
- HR
-
heart rate
- BSA
-
Body surface area
- UA
-
uric acid
- eGFR
-
estimated glomerular filtration rate
- Cr
-
creatinine
- BUN
-
Blood Urea Nitrogen
- Cys-C
-
cystatin C
- P
-
phosphorus
- Ca
-
calcium
- TG
-
triglyceride
- CHOL
-
total cholesterol
- HDL
-
high-density lipoprotein
- LDL
-
low-density lipoprotein
- HGB
-
hemoglobin
- ALB
-
albumin
Table 2 illustrates those patients with LVGLS ≥ −15.2% demonstrate augmented LVESD and LVESV on CMR compared to those with LVGLS <−15.2%. Furthermore, individuals with LVGLS ≥ −15.2% exhibit heightened LVM and LVMI (80.94 g/m2 vs. 62.33 g/m2), alongside significantly diminished LVEF (42.63% vs. 56.42%) and lower RVEF. Moreover, patients with LVGLS ≥−15.2% manifest decreased overall GRS (20.04% vs. 31.15%) and GCS in the left ventricular myocardium. Notably, no significant difference is observed in LAD and LVEDVI between the two groups.
| Variable | LV GLS <-15.2 (n = 28) | LV GLS ≥-15.2 (n = 49) | P-value |
|---|---|---|---|
| LVEDD (mm) | 51.11 ± 3.98 | 52.02 ± 8.31 | 0.795 |
| LVESD (mm) | 31.79 ± 5.31 | 37.65 ± 9.97 | 0.008 |
| LAD (mm) | 35.21 ± 5.61 | 35.9 ± 7.17 | 0.13 |
| LV FS (%) | 37.73 ± 8.55 | 28.43 ± 10.72 | 0.181 |
| LVEDV (ml) | 148.73 ± 36.63 | 172.66 ± 69.56 | 0.182 |
| LVESV (ml) | 65.51 ± 21.1 | 103.83 ± 57.47 | 0.001 |
| LVSV (ml) | 83.22 ± 19.92 | 68.81 ± 21.07 | 0.885 |
| LVEF (%) | 56.42 ± 7.12 | 42.63 ± 11.98 | <0.001 |
| CO (l/min) | 6.32 ± 1.72 | 5.65 ± 1.67 | 0.734 |
| CI (l/min/m2) | 3.93 ± 1.14 | 3.5 ± 0.96 | 0.15 |
| LV mass (g) | 100.7 ± 24.22 | 131.27 ± 41.89 | 0.002 |
| LVMI (g/m2) | 62.33 ± 13.76 | 80.94 ± 22.65 | 0.012 |
| LVEDVI (ml/m2) | 89.32 ± 21.93 | 106.05 ± 40.12 | 0.076 |
| RVEDD (mm) | 31.46 ± 4.98 | 28.73 ± 5.13 | 0.617 |
| RVESD (mm) | 21.75 ± 5.43 | 20.16 ± 5.75 | 0.688 |
| RAD (mm) | 43.32 ± 5.77 | 43.47 ± 8.48 | 0.384 |
| RVEDV (ml) | 139.57 ± 31.67 | 129.45 ± 46.13 | 0.122 |
| RVESV (ml) | 62.27 ± 18.24 | 71.84 ± 44.24 | 0.962 |
| RVSV (ml) | 77.3 ± 20.75 | 57.61 ± 18.53 | 0.314 |
| RVEF (%) | 55.3 ± 7.76 | 47.2 ± 14 | 0.007 |
| LV GCS (%) | −18.58 ± 1.85 | −13.51 ± 3.44 | <0.001 |
| LV GRS (%) | 31.15 ± 4.78 | 20.04 ± 7.12 | <0.001 |
Notes:
- LV-GLS
-
left ventricular global longitudinal strain
- LVEDD
-
left ventricular end-diastolic diameter
- LVESD
-
left ventricular end-systolic diameter
- LAD
-
left atrial diameter
- LVFS
-
left ventricular fractional shortening
- LVEDV
-
left ventricular end-diastolic volume
- LVESV
-
left ventricular end-systolic volume
- LVSV
-
left ventricular systolic volume
- LVEF
-
left ventricular ejection fraction
- CO
-
cardiac output
- CI
-
Cardiac index
- LV mass
-
left ventricular mass
- LVMI
-
Left ventricular mass index
- LVEDVI
-
Left ventricular end-diastolic volume index
- RVEDD
-
right ventricular end-diastolic diameter
- RVESD
-
right ventricular end-systolic diameter
- RAD
-
right atrial diameter
- RVEDV
-
right ventricular end-diastolic volume
- RVESV
-
right ventricular end-systolic volume
- RVSV
-
right ventricular systolic volume
- RVEF
-
right ventricular ejection fraction
- LVGCS
-
left ventricular global circumferential strain
- LV GRS
-
left ventricular global radial strain
Values in bold highlight the parameters with statistical significance.
The findings of the univariable and multivariable analyses are delineated in Table 3. LVESD and LVM were excluded from the multivariable model to mitigate multicollinearity. The univariable analysis encompassed variables known to impact LVGLS, with the majority demonstrating significant disparities between patients with LVGLS ≥ −15.2% and LVGLS <−15.2%. The multivariable analysis incorporated variables significantly linked to LVGLS ≥−15.2%. Ultimately, the outcomes revealed that solely an increased LAD was independently associated with LVGLS ≥ −15.2%.
| Univariable | Multivariable | |||
|---|---|---|---|---|
| OR (95% CI) | P-value | OR (95% CI) | P-value | |
| HR (bpm) | 2.10(0.33–13.35) | 0.432 | 3.82(0.50–29.26) | 0.197 |
| LAD (mm) | 3.50(1.36–9.04) | 0.010 | 3.92(1.31–11.73) | 0.014 |
| LVESV (ml) | 1.46(0.53–4.04) | 0.468 | 0.73(0.12–4.26) | 0.723 |
| LVEF (%) | 1.31(0.53–3.25) | 0.554 | 0.56(0.16–2.02) | 0.379 |
| LVMI (g/m2) | 2.63(1.03–6.72) | 0.043 | 2.20(0.62–7.81) | 0.222 |
| LVEDVI (ml/m2) | 1.73(0.61–4.95) | 0.304 | 1.28(0.25–6.65) | 0.767 |
| RVEF (%) | 2.64(0.89–7.82) | 0.079 | 2.34(0.64–8.55) | 0.200 |
Notes:
- HR
-
heart rate
- LAD
-
left atrial diameter
- LVESV
-
left ventricular end-systolic volume
- LVEF
-
left ventricular ejection fraction
- LVMI
-
Left ventricular mass index
- LVEDVI
-
Left ventricular end-diastolic volume index
- RVEF
-
right ventricular ejection fraction
Values in bold highlight the parameters with statistical significance.
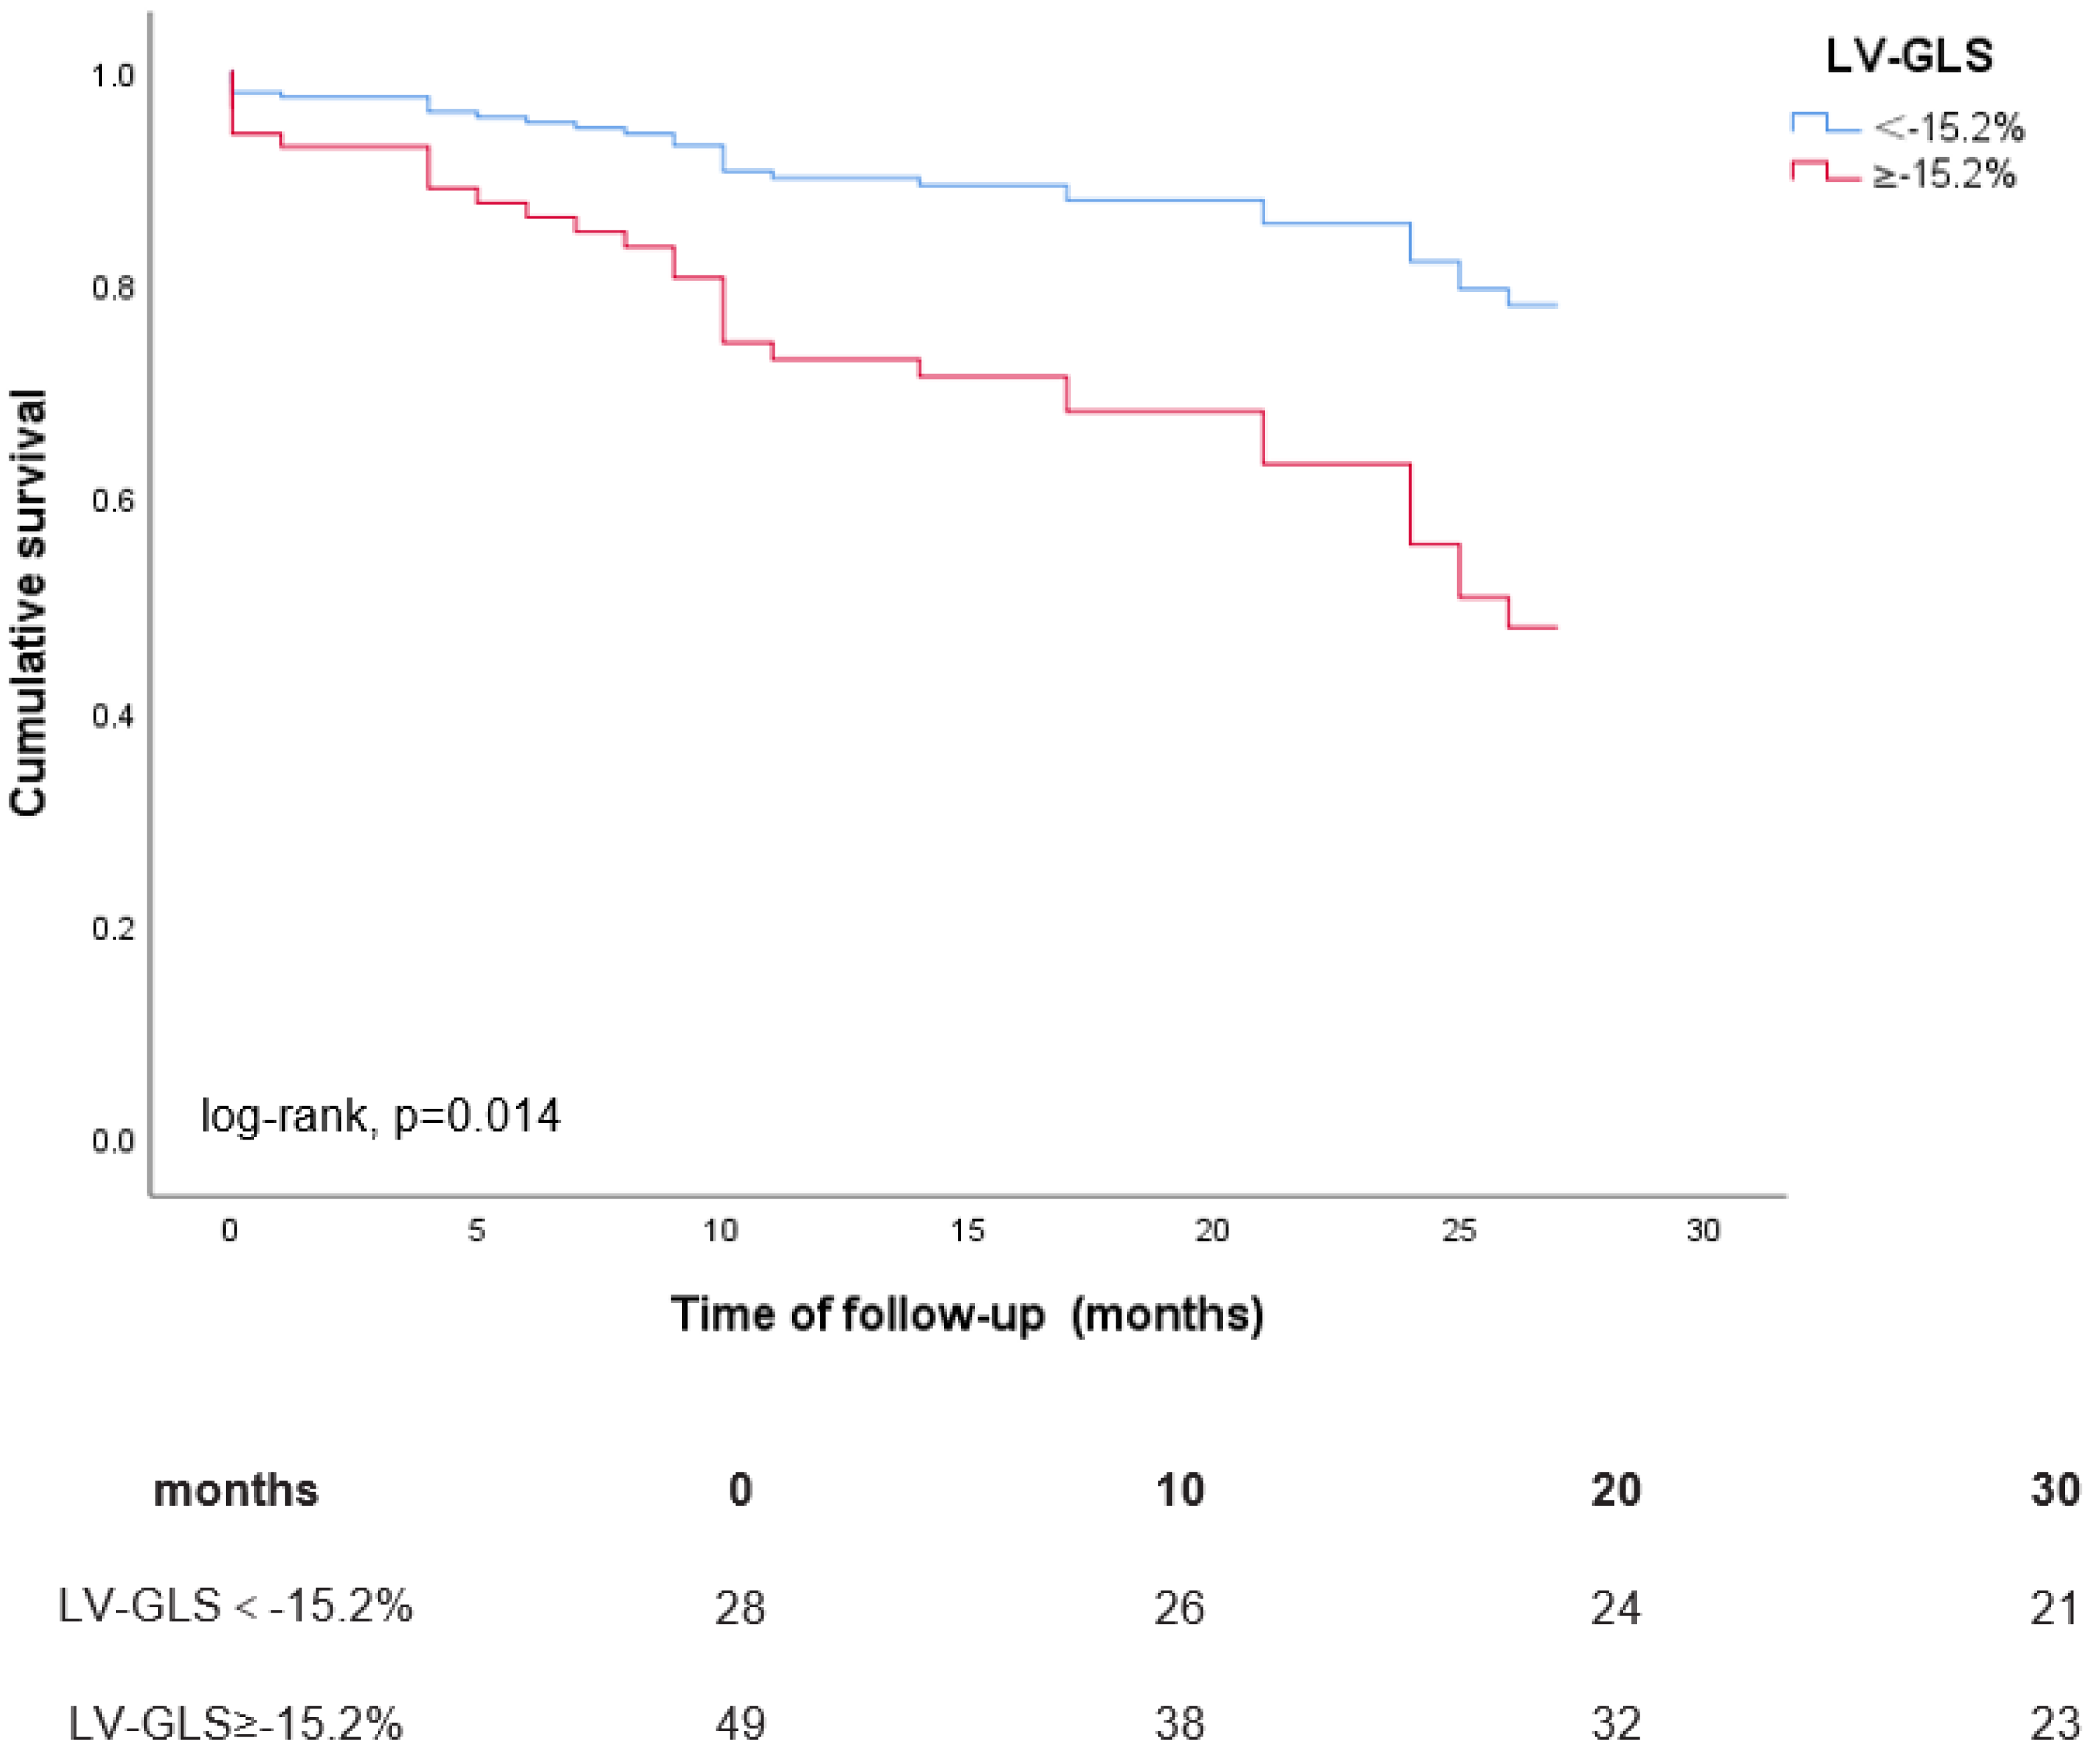
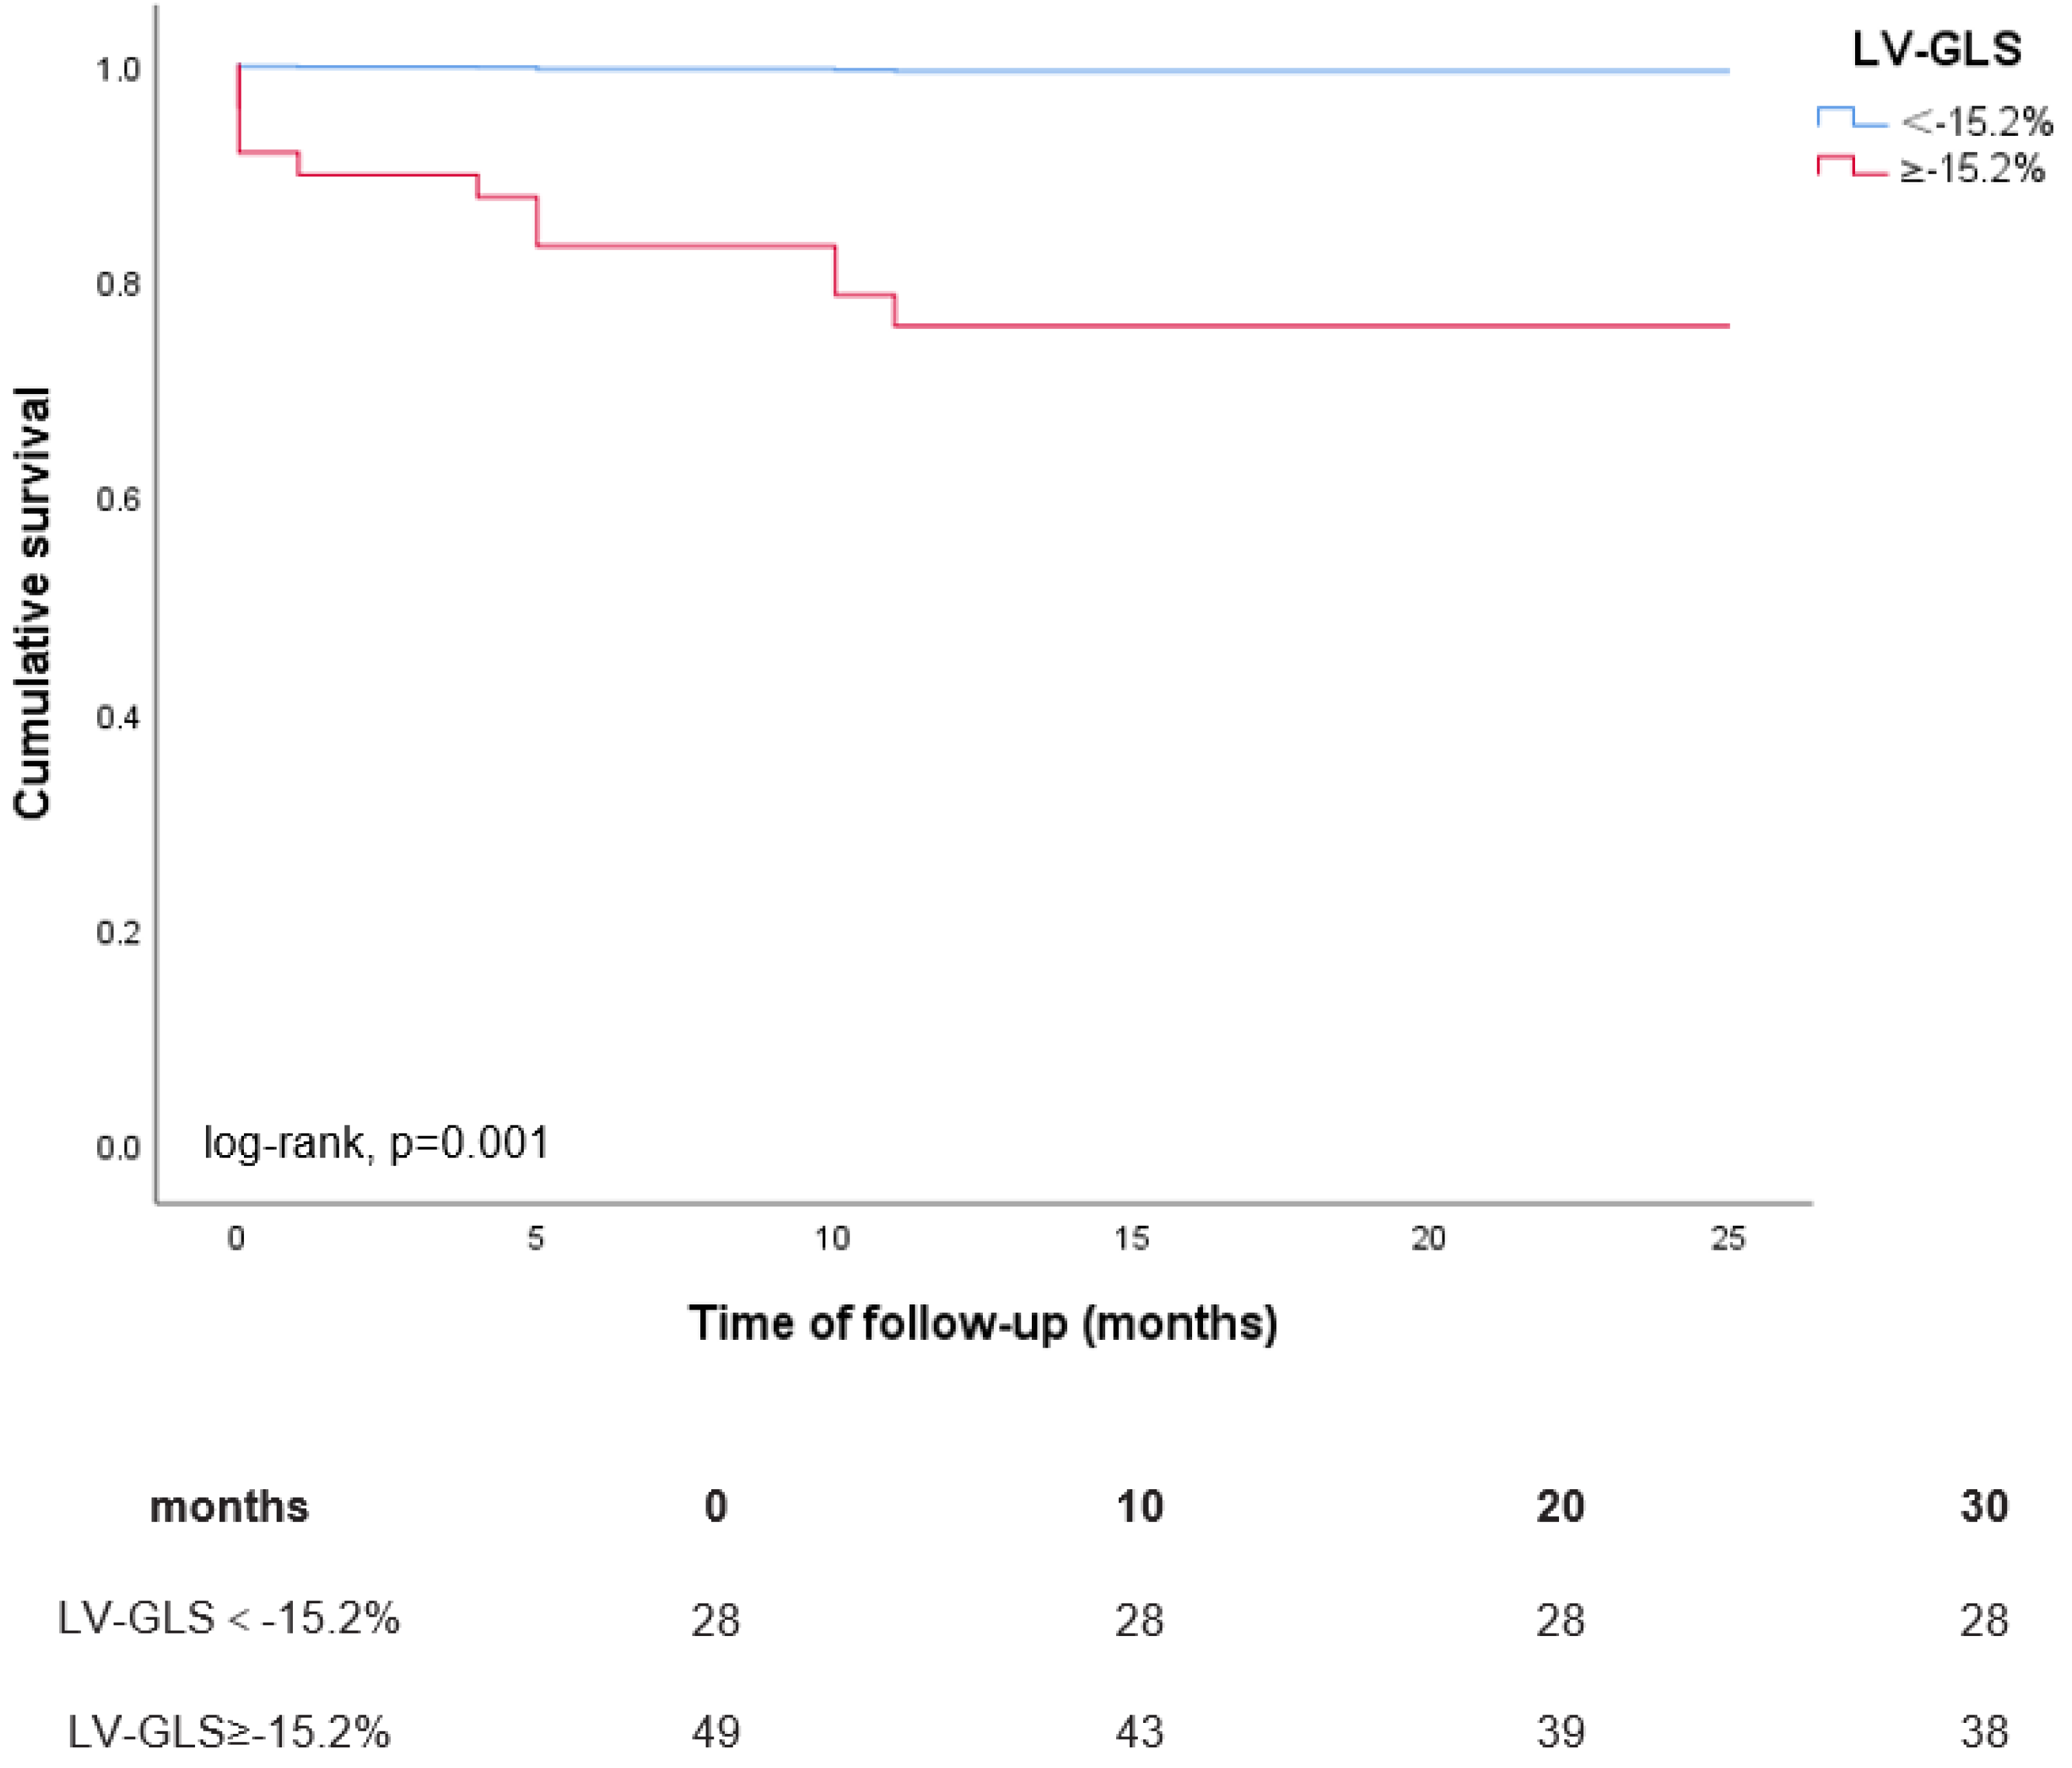
During a mean follow-up period of 22 ± 9 months, a total of 33 (43%) patients experienced the composite endpoint of HHF and all-cause mortality, comprising 11 (14%) deaths and 30 (39%) instances of heart failure-related hospitalizations, with 8 patients experiencing both events concurrently. The Kaplan–Meier curves depicted in Fig. 2 illustrate the outcomes of the composite endpoint for patients with LVGLS ≥ −15.2% compared to those with LVGLS <−15.2%. Patients exhibiting LVGLS ≥ −15.2% demonstrated notably lower cumulative event-free survival rates for HHF and all-cause mortality compared to their counterparts with LVGLS <−15.2% (0.62 vs. 0.84 at 20 months of follow-up; log-rank P = 0.014). Additionally, the Kaplan–Meier curves in Fig. 3 depict the results of all-cause mortality among patients with LVGLS ≥ −15.2% versus LVGLS <−15.2%. Notably, patients with LVGLS ≥ −15.2% exhibited substantially inferior prognosis relative to those with LVGLS <−15.2%, with cumulative survival rates at 20 months of 0.76 vs. 1.00, respectively (log-rank P = 0.001).
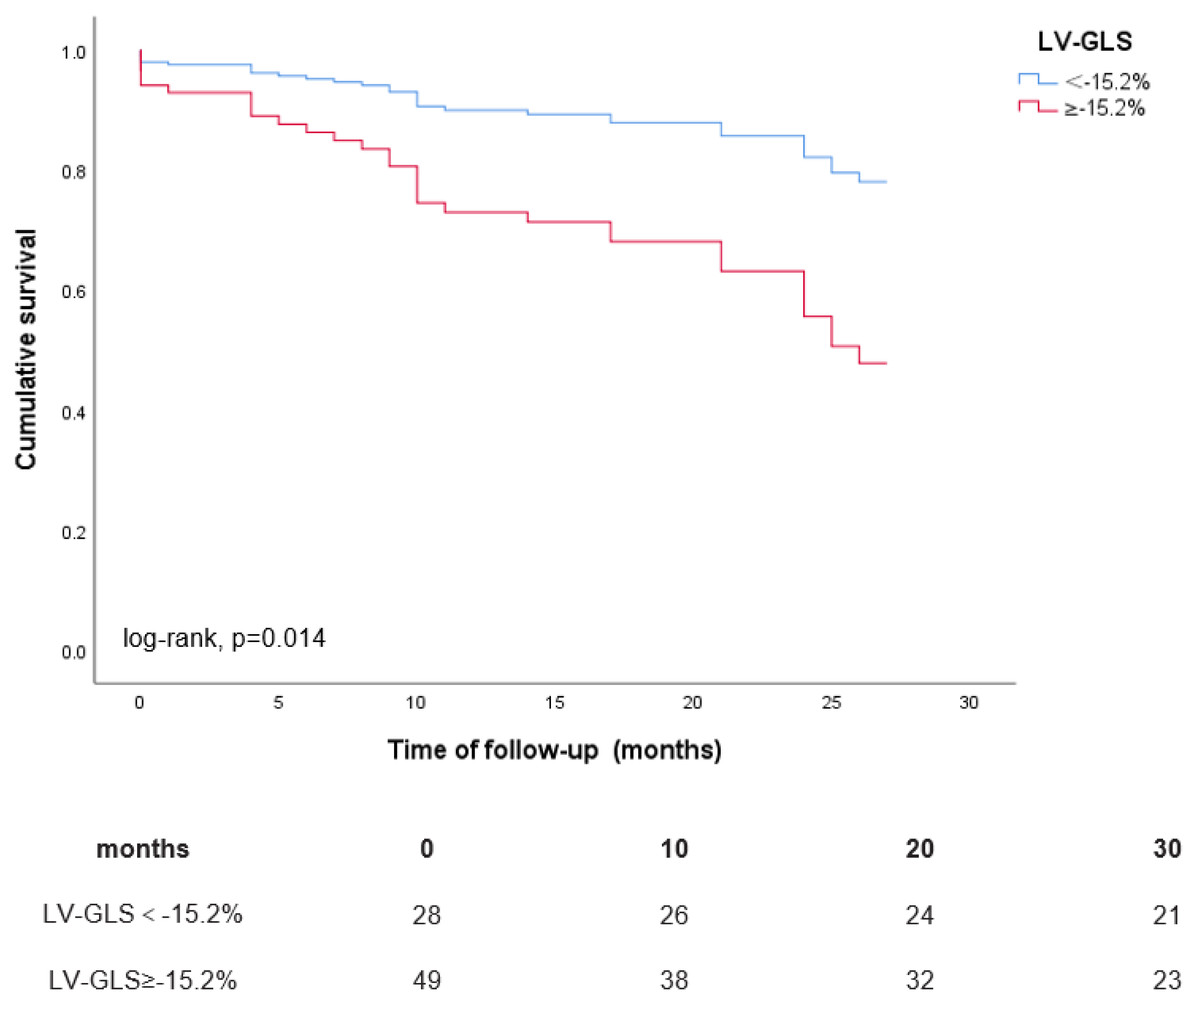
Figure 2: Kaplan–Meier curves for the composite endpoint of HHF and all-cause mortality according to LVGLS ≥ −15.2% vs. LVGLS <−15.2%.
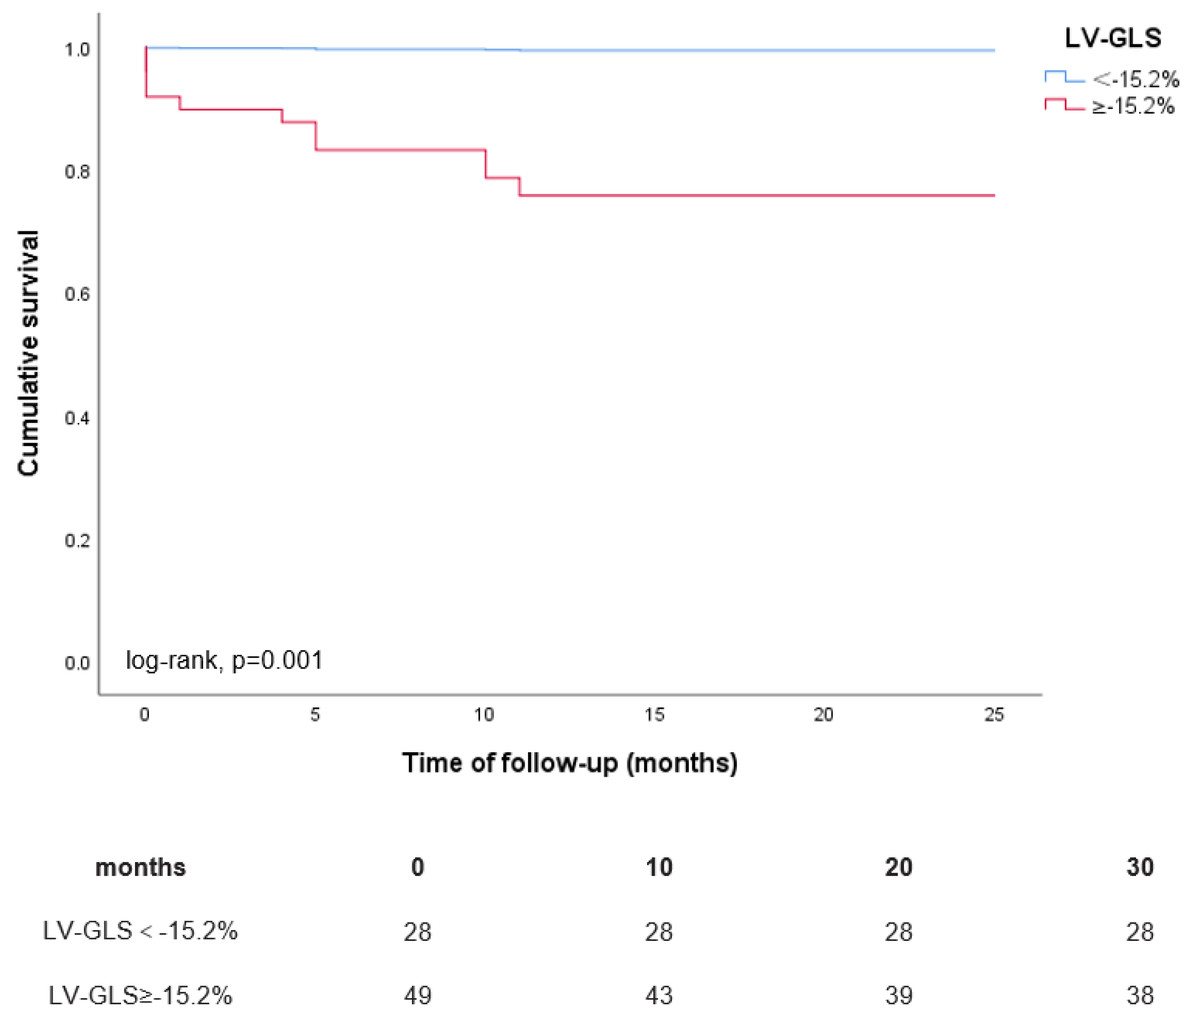
Figure 3: Kaplan–Meier curves for all-cause mortality according to LVGLS ≥−15.2% vs. LVGLS<−15.2%.
In the univariate regression analysis, variables such as age, LAD, LVMI, LVGLS, and diabetes were correlated with a heightened risk for the combined endpoint of HHF and all-cause mortality (Table 4). Upon conducting a Cox proportional hazards multivariate analysis, age, diabetes, and LVGLS were significantly associated with the risk of endpoint events, whereas LVMI showed no significant association. After adjustments for age, diabetes, LAD, and LVMI, a compromised LVGLS was independently predictive of an elevated risk for the composite endpoint (HR: 3.40, 95% CI [1.35–8.56], P = 0.009) as delineated in Table 4.
| Univariable | Multivariable | |||
|---|---|---|---|---|
| HR (95% CI) | P-value | HR (95% CI) | P-value | |
| Age (y) | 3.18(1.60–6.33) | 0.001 | 3.56(1.71–7.42) | 0.001 |
| Hypertension | 2.20(0.67–7.20) | 0.194 | – | – |
| Diabetes | 2.53(1.26–5.04) | 0.009 | 2.44(1.18–5.08) | 0.017 |
| HGB | 0.80(0.44–1.46) | 0.471 | – | – |
| LAD (mm) | 2.60(1.26–5.38) | 0.010 | 1.79(0.82–3.89) | 0.141 |
| LVMI (g/m2) | 1.88(0.92–3.92) | 0.042 | 1.60(0.71–3.64) | 0.260 |
| LVEF (%) | 1.17(0.59–2.32) | 0.654 | – | – |
| LV-GLS (%) | 2.64(1.15–6.09) | 0.023 | 3.40(1.35–8.56) | 0.009 |
Notes:
- HGB
-
hemoglobin
- LAD
-
left atrial diameter
- LVMI
-
Left ventricular mass index
- LVEF
-
left ventricular ejection fraction
- LV-GLS
-
left ventricular global longitudinal strain
Values in bold highlight the parameters with statistical significance.
Discussion
This investigation demonstrates that the predominant fraction of individuals with advanced CKD exhibit compromised left ventricular myocardial systolic function, notwithstanding the preservation of left ventricular ejection fraction in certain cases. An enlargement in LAD independently correlates with deteriorated LVGLS. Additionally, CKD subjects exhibiting impaired LVGLS encounter an elevated incidence of HHF and all-cause mortality relative to their counterparts within this cohort.
This study noted that nearly two-thirds of individuals with CKD demonstrated left ventricular systolic dysfunction. An augmented LAD independently correlated with LVGLS of ≥ −15.2%. Various factors, such as myocardial fluid retention, inflammation from CKD, toxin accumulation, and myocardial fibrosis, may contribute to the reduction in LVGLS observed in CKD patients (Arcari et al., 2021). Furthermore, the study by Zhang et al. (2021) posited that individuals with concurrent diabetes and CKD are prone to more severe cardiovascular impairment, including compromised LVGLS, alongside an escalated risk of heart failure and mortality. In our research, while a direct comparison of LVGLS between CKD patients with and without diabetes was not conducted, a diminished LVGLS notably elevated the risk of heart failure hospitalization and all-cause mortality, even after adjustment for pertinent variables (HR: 3.40, 95%CI [1.35–8.56], P = 0.009), aligning with certain speckle-tracking echocardiography studies. This finding is consistent with some speckle-tracking echocardiography studies. Pressman et al. (2015) uncovered a marked relationship between adjusted LVGLS and mortality, utilizing an LVGLS ≥-16% threshold (HR: 1.30, 95%CI [1.10–1.56], P = 0.002). Similarly, Hensen et al. (2018) reported analogous findings in CKD patients with preserved left ventricular ejection fraction, applying an LVGLS ≥−15.2% benchmark (HR: 0.91, 95%CI [0.83–0.999], P = 0.047). Future research may need to explore whether the extent of LVGLS damage is more severe in patients with CKD and diabetes and investigate its impact on prognosis.
Our findings suggest no significant link between elevated LVMI and the risk of HHF or mortality in CKD patients. Additionally, evidence points to lower LVMI levels in the Chinese population compared to Western cohorts (Lu et al., 2011). The current association between changes in LVMI and increased risk of heart failure admission and mortality remains uncertain. Early studies using CMR by (Bluemke et al., 2008) suggested that LVMI is the best predictor of heart failure . Meanwhile, (Sági et al., 2022) conducted a study using echocardiography and proposed that higher LVMI may be an independent prognostic factor for end-stage kidney disease and cardiovascular events. In contrast, the study involving over 12,000 patients with hypertension, showed that the reduction in left ventricular hypertrophy was not correlated with cardiovascular events (Costanzo et al., 2013). Agarwal et al. (2020) posited that the relationship between LVMI and the progression of CKD is bidirectional. Another meta-analysis concluded that the clinical significance of reduced LVMI in patients with CKD post-treatment remains uncertain, indicating that LVMI is not suitable for predicting adverse outcomes in patients with CKD (Badve et al., 2016). The elevation of LVMI in CKD patients stems from interrelated factors. Reduced glomerular filtration rate exacerbates cardiac remodeling, myocardial fibrosis, and hypertrophy, partly due to uremic toxin accumulation in the myocardial interstitium and their direct impact on myocardial cells (Hayer et al., 2020). Furthermore, traditional cardiovascular risk factors like hypertension and diabetes, prevalent among CKD patients, contribute to this increase (Kidney Disease: Improving Global Outcomes (KDIGO) Diabetes Work Group, 2022). These findings suggest LVMI elevation is a consequence, not a cause, of advancing CKD. Therefore, we believe that the use of LVMI for prognostic assessment in Asian CKD patients should be approached with caution, and further multicenter studies with large sample sizes are essential.
Limitations
This study has several limitations. Firstly, as a single-center retrospective analysis with a small cohort, it may be subject to selection bias. Secondly, the specific influence of diabetes on LVGLS in CKD patients remains unclear, highlighting the need for further investigation into the relationship between LVGLS impairment in diabetic CKD patients and their prognosis. Multicenter, prospective research is needed to confirm our results. Third, our analysis excluded CMR T1 and T2 mapping parameters due to the late initiation of CMR at our facility, with authorization for T1 and T2 sequences only granted in 2021. Additionally, the study did not account for all potential confounders, such as detailed medication histories, possibly affecting outcomes.
Conclusion
In summary, this research offers valuable insights into the correlation between LVGLS and HHF as well as all-cause mortality in CKD patients. The utility of LVMI in prognostication for Asian CKD patients necessitates careful consideration. These findings carry significant clinical relevance for optimizing CKD patient management and enhancing their prognostic outlook.
Supplemental Information
Additional Information and Declarations
Competing Interests
The authors declare that they have no competing interests.
Author Contributions
Wenju Zhang conceived and designed the experiments, performed the experiments, analyzed the data, prepared figures and/or tables, authored or reviewed drafts of the article, and approved the final draft.
Yi Zhong performed the experiments, authored or reviewed drafts of the article, and approved the final draft.
Fang Zhong performed the experiments, prepared figures and/or tables, and approved the final draft.
Tianhui Zhang analyzed the data, prepared figures and/or tables, and approved the final draft.
Xinghua Zhu conceived and designed the experiments, authored or reviewed drafts of the article, and approved the final draft.
Weixiong Fan conceived and designed the experiments, authored or reviewed drafts of the article, and approved the final draft.
Human Ethics
The following information was supplied relating to ethical approvals (i.e., approving body and any reference numbers):
This research was approved by Meizhou People’s Hospital Ethics Review Committee (no. 2023-C-107).
Data Availability
The following information was supplied regarding data availability:
The raw measurements are available in the Supplementary File.
Funding
The authors received no funding for this work.
