
Interpretable noninvasive diagnosis of tuberculous pleural effusion using LGBM and SHAP: development and clinical application of a machine learning model
Author and article information
Abstract
Background
Tuberculous pleural effusion (TPE) is a prevalent tuberculosis complication, with diagnosis presenting considerable challenges. Timely and precise identification of TPE is vital for effective patient management and prognosis, yet existing diagnostic methods tend to be invasive, lengthy, and often lack sufficient accuracy. This study seeks to design and validate an interpretable machine learning model based on routine laboratory data to enable noninvasive and rapid TPE diagnosis.
Methods
A multicenter prospective study was conducted across China between January 2021 and September 2024, enrolling 963 patients. The derivation cohort, comprising 763 patients, was employed for model training and internal validation, while 200 patients formed the external validation cohort. The model was built upon 18 routine laboratory parameters, including pleural fluid and serum biomarkers, with multiple machine learning (ML) algorithms evaluated. Light gradient boosting machine (LGBM) emerged as the top-performing model. Shapley Additive exPlanations (SHAP) analysis assessed feature importance and interpretability. Model performance was evaluated via area under the curve (AUC) and accuracy metrics.
Results
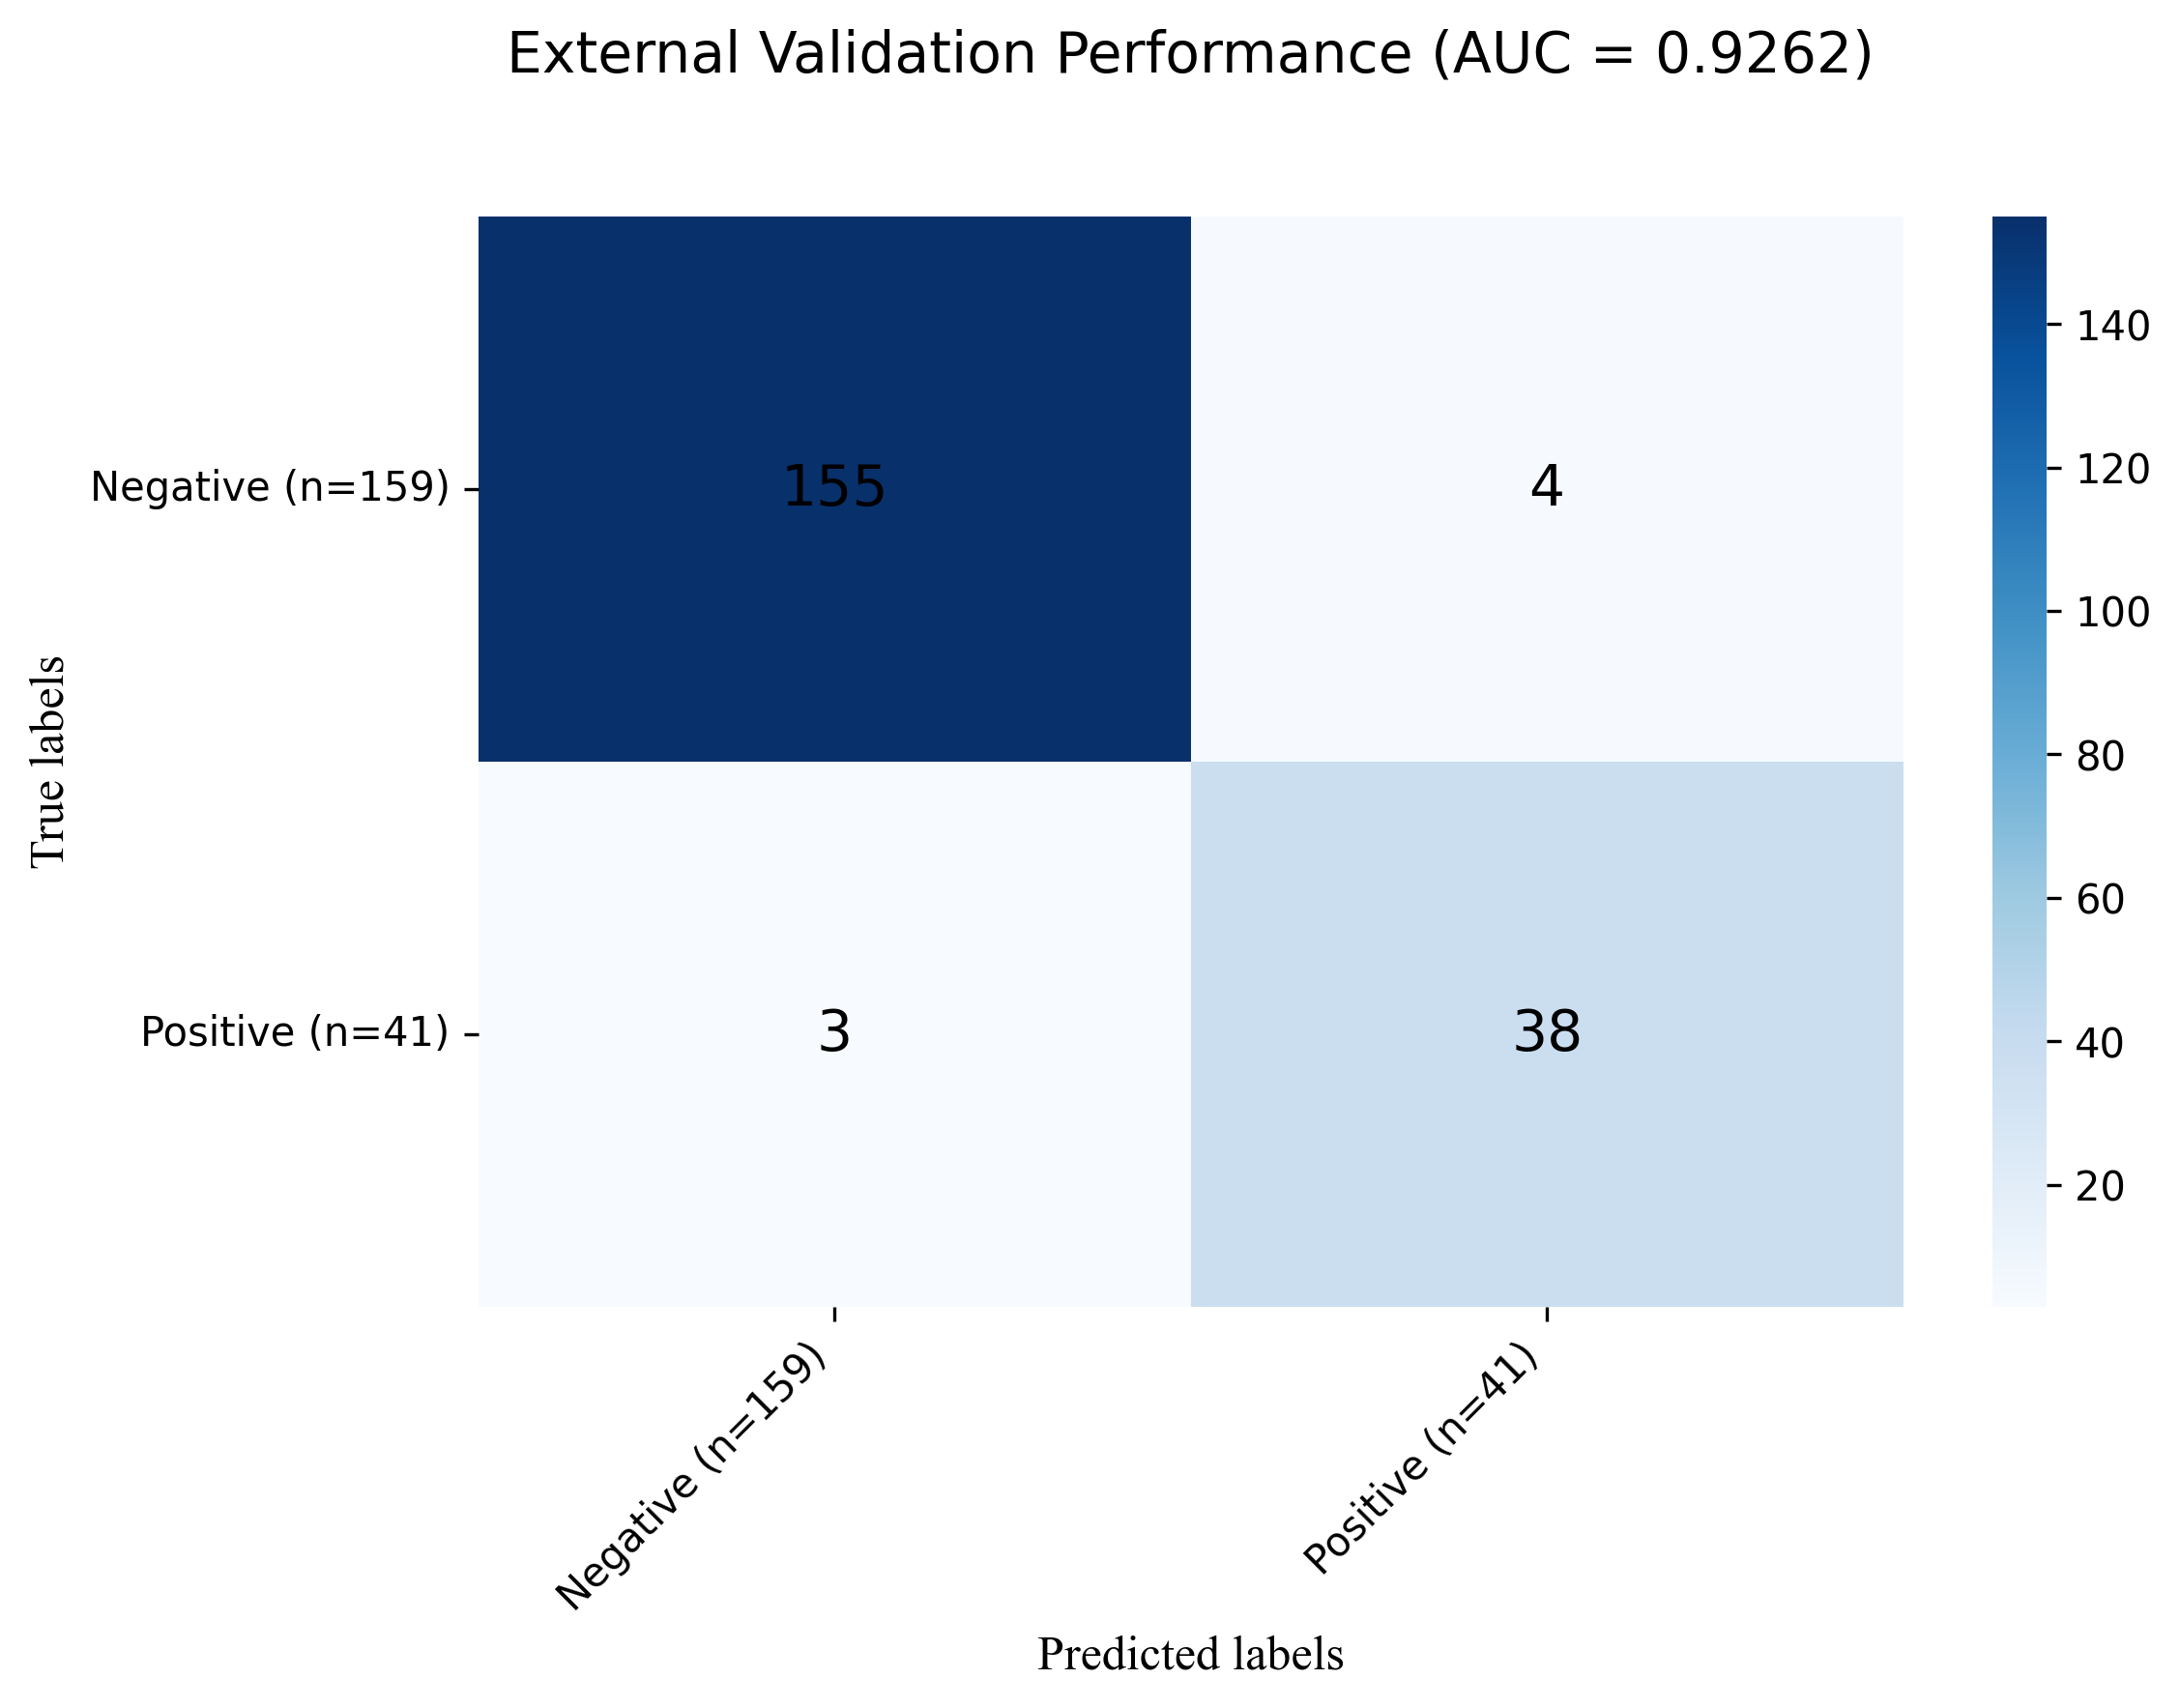
Of the 10 ML models compared, LGBM demonstrated superior performance. Feature importance analysis identified 11 key variables, leading to constructing a highly interpretable LGBM model. The model achieved an AUC of 0.9454 in internal validation and 0.9262 in external validation, showcasing strong robustness and generalizability. SHAP analysis enhanced interpretability by highlighting each feature’s contribution to prediction outcomes. This model has since been integrated into clinical practice for noninvasive, rapid TPE diagnosis. During external validation, the model achieved a sensitivity of 0.8600, specificity of 0.9056, positive predictive value of 0.8698, and negative predictive value of 0.8686, underscoring its accuracy across diverse patient cohorts.
Interpretation
This interpretable machine learning model offers a noninvasive, accurate solution for early TPE diagnosis, significantly reducing reliance on invasive procedures. The integration of SHAP ensures the model’s clinical interpretability, mitigating concerns surrounding the “black-box” nature of many machine learning approaches.
Conclusions
This interpretable LGBM-based model provides a reliable, noninvasive tool for TPE diagnosis. It supports clinical decision-making with real-time risk assessment and promises broader applicability through future integration into clinical information systems.
Cite this as
2025. Interpretable noninvasive diagnosis of tuberculous pleural effusion using LGBM and SHAP: development and clinical application of a machine learning model. PeerJ 13:e19411 https://doi.org/10.7717/peerj.19411Main article text
Introduction
Tuberculosis (TB) remains a significant global public health issue (Raviglione et al., 2012; Guy & Mallampalli, 2008), particularly in developing nations. According to the World Health Organization (WHO), approximately 10 million new TB cases are reported annually worldwide (Zumla et al., 2013; Lawn & Zumla, 2011), with developing regions experiencing the highest incidence rates. Tuberculous pleural effusion (TPE), a frequent complication of TB (Gopi et al., 2007; Light, 2010), affects 5–10% of hospitalized TB patients. The burden of TPE is particularly severe in Asia and Africa (World Health Organization, 2010; Zumla et al., 2012), where TB prevalence is high and healthcare resources are limited. Early and accurate diagnosis of TPE is essential for improving patient outcomes (McNerney et al., 2012), yet the clinical manifestation often overlaps with other pleural diseases, complicating diagnosis (McNerney et al., 2012; McNally, Ross & Gleeson, 2023). Current methods, including acid-fast bacilli (AFB) smear, culture, and pleural biopsy (Porcel, 2016), while valuable, are invasive, costly, and time-consuming, limiting their feasibility in resource-constrained settings (Zhai, Lu & Shi, 2016). Moreover, the diagnostic efficacy of noninvasive biomarkers, such as interferon-gamma (IFN-γ) and adenosine deaminase (ADA) (Chen et al., 2016; Aggarwal et al., 2019; Porcel, 2018; Barnes et al., 1990; Diel et al., 2011), varies across regions and populations (Porcel, 2009), adding further complexity to the diagnostic landscape.
The rapid advancements in data science and machine learning offer promising new avenues for medical diagnostics (Cabitza, Rasoini & Gensini, 2017), with the potential to enhance diagnostic efficiency (Bhinder et al., 2021; Mintz & Brodie, 2019) and accuracy by analyzing complex clinical datasets (Cruz & Wishart, 2007). However, few studies have focused on the noninvasive, rapid diagnosis of TPE, underscoring the urgent need for a reliable tool based on routine laboratory data to reduce dependence on invasive procedures and streamline the diagnostic process.
Ren, Hu & Xu (2019) applied a random forest model for TPE diagnosis, achieving favorable results. However, random forest models (Breiman, 2001) may struggle with complex data structures. In contrast, the light gradient boosting machine (LGBM) (Yang et al., 2024) has shown superior performance, processing large datasets with incredible speed and addressing the misclassification of minority classes in imbalanced data. By incorporating the Shapley Additive exPlanations (SHAP) method (Wang et al., 2024), LGBM delivers accurate diagnostic predictions and offers a transparent, visual explanation of feature contributions, enabling clinicians to comprehend the model’s decision-making process better and enhance clinical credibility.
This study evaluated multiple machine learning algorithms and found that the combination of LGBM and SHAP outperforms other algorithms in terms of interpretability and accuracy. Our goal is to develop this model into an efficient, accurate, and user-friendly diagnostic tool for TPE, providing an innovative solution to the global challenge of tuberculosis diagnosis. By comparing LGBM, random forest, support vector machines (SVM), and other models, we found that LGBM performs best in terms of accuracy, sensitivity, and specificity, particularly in early diagnosis and complex cases.
Materials and Methods
Data collection protocol
Data was collected from January 1, 2021, to September 30, 2024, based on criteria such as TPE diagnosis and laboratory results (ADA, TB-Ab). The data was collected by trained medical staff to ensure accuracy and consistency. Standardized procedures, including specific steps for sample collection, processing, and analysis, were developed by the hospital’s Ethics Committee and Laboratory Quality Management Department. These procedures were strictly followed throughout the study to ensure the reliability of the collected data.
Data sources
Total participants: This study included 963, 424 patients diagnosed with TPE and 539 non-TPE control patients. It is a prospective, multicenter, observational study designed to develop and validate a machine-learning model based on routine laboratory data for noninvasive TPE diagnosis. Data collection spanned from January 2021 to September 2024 at two medical centers in China: Zhejiang Provincial People’s Hospital and Jiashan County First People’s Hospital.
Data collection: Data were extracted from the hospital (HIS) and laboratory (LIS) information systems at Zhejiang Provincial People’s Hospital and The First People’s Hospital of Jiashan. The study included 20 laboratory parameters, including protein, lymphocyte, tuberculosis antibody (TB Ab), erythrocyte sedimentation rate (ESR), adenosine deaminase (ADA), lactate dehydrogenase (LDH), nucleated cell count (NCC), eosinophil, sex, carcinoembryonic antigen (CEA), Cancer Antigen 15-3 (CA153), Cancer Antigen 12-5 (CA125), Cytokeratin 19 (CK19), alpha-fetoprotein (AFP), Cancer Antigen 199 (CA199), chloride, squamous cell carcinoma (SCC), glucose, age, and macrophage.
Data preprocessing: Missing data were handled using mean imputation. Categorical variables were encoded for processing, and features with >25% missing data were excluded. A Spearman correlation analysis removed highly correlated features (r > 0.6) to minimize redundancy and overfitting.
Feature selection: Lymphocytes and macrophages were excluded from the model due to their potential to cause overfitting, despite being clinically relevant. The remaining 18 laboratory parameters were selected based on their clinical importance and association with TPE, as demonstrated in previous studies. Parameters such as ADA and TB-Ab, which are well-established biomarkers for TPE and routinely measured in clinical practice, were included. This selection ensures both diagnostic accuracy and practical applicability.
Inclusion criteria: Patients aged ≥18 years with suspected pleural effusion and a confirmed diagnosis of tuberculous pleural effusion (TPE), based on pleural biopsy, positive Mycobacterium tuberculosis culture, or documented tuberculosis history, were included.
Exclusion criteria: Patients were excluded if they had incomplete clinical data, unclassified pleural effusion, no follow-up, or major health conditions such as active infections or unrelated malignancies. The non-TPE group included patients with other respiratory diseases, such as chronic obstructive pulmonary disorder (COPD), pneumonia, and non-tuberculous effusions (e.g., malignancy, heart failure).
Data application and processing
Data cohorts: Datasets are typically divided into training, testing, and validation sets, as models tend to perform best on their training data (James et al., 2013; Hastie, 2009; Molnar, 2020). The training cohort (Cohort 1, n = 610) and the testing cohort (Cohort 2, n = 153) were randomly assigned, using data collected between January 2021 and January 2024 for model development and internal validation. The external validation cohort (Cohort 3, n = 200) comprised data collected between February 2024 and September 2024 to assess the model’s generalizability. The training cohort consists of data from 2021 to 2024, while the validation cohort includes data from 2024. This time difference allows us to evaluate the model’s generalizability and performance on more recent data, ensuring its robustness across evolving patient demographics and clinical practices.
Data preprocessing: To ensure optimal data quality and model performance, preprocessing steps were implemented. Missing values were addressed using mean imputation for randomly distributed gaps in the data. Categorical variables, such as TB-Ab, were numerically encoded (0 for negative, 1 for weak positive, and 2 for positive) to facilitate processing. A Spearman correlation analysis was performed to eliminate features with high collinearity (correlation coefficient > 0.6), reducing redundancy and enhancing model generalizability. Despite their clinical significance, lymphocytes and macrophages were excluded to prevent overfitting. The missing data were handled using mean imputation, and variables with more than 25% missing data were excluded. While mean imputation was used, more advanced techniques, such as multiple imputation or model-based imputation, could be explored in future work, especially when the missing data are not random.
Model development: Ten machine learning models, including LGBM, gradient boosting decision trees (GBDT), and support vector machines (SVM), were developed using data from the training and testing cohorts. The LGBM model achieved the highest predictive accuracy. SHAP analysis enhanced interpretability, identifying 11 key features (e.g., ADA, TB-Ab, protein) crucial to the model’s performance.
External validation: The LGBM model was validated using Cohort 3, demonstrating superior diagnostic performance compared to conventional clinical methods. The model accurately identified patients with TPE, highlighting its potential as an effective diagnostic tool.
Feature selection
Clinical expert screening: Feature selection was grounded in clinical relevance and supported by existing literature. Based on prior studies and clinical experience, clinical experts initially selected laboratory parameters strongly associated with TPE, such as protein levels, ADA activity, and glucose levels. These parameters served as the foundation for model development.
Feature importance evaluation: The LGBM model assessed feature importance, ranking features by their contribution to the model’s predictive capabilities. Following this evaluation, 11 key features were retained, substantially enhancing the model’s accuracy.
Final feature set: The streamlined LGBM model incorporated these 11 key features, demonstrating robust predictive power for diagnosing TPE. This final model offers reliable support for clinical decision-making, improving diagnostic efficiency in practice.
Machine learning model construction
Machine learning algorithms
In this study, we evaluated ten standard machine learning algorithms, including SVM (Wu & Yang, 2015), random forest (RF) (Breiman, 2001), decision trees (DT) (Karalis, 2020), K-nearest neighbors (KNN) (Ali et al., 2020), adaptive boosting (AdaBoost), LGBM, and GBDT (Yıldız & Kalayci, 2024). To enhance model robustness and mitigate overfitting, we employed 5-fold cross-validation, utilizing a study cohort of 763 patients and an independent validation cohort of 200 patients. Model hyperparameters were optimized using grid search to maximize predictive performance.
The reason for choosing these models is that they have demonstrated good performance in similar diagnostic tasks and have been widely used in relevant literature. Decision trees are widely applied in classification problems due to their interpretability and simplicity, while Adaptive Boosting enhances model accuracy and robustness by integrating multiple weak learners. Therefore, these models are considered the most suitable choices for this study.
Standard machine learning algorithms such as logistic regression (Shah et al., 2020), SVMs leveraging kernel functions, and decision trees are foundational in predictive modeling. Ensemble methods, particularly bagging (e.g., random forest) and boosting approaches (e.g., GBDT and its optimized variant, LGBM, have demonstrated superior performance in tabular data contexts. These ensemble methods integrate multiple weak learners to enhance generalization capabilities and, as such, were the focus of subsequent experiments.
LGBM, a highly efficient GBDT algorithm developed by Microsoft, iteratively constructs weak learners (primarily decision trees) to improve predictive accuracy by rectifying prior errors (Meidan et al., 2020). It is a powerful machine learning tool used to help computers make predictions based on data. Imagine it as a system that learns from past examples to predict future outcomes, like predicting whether a patient has a disease based on medical records. It works by combining many small decision-makers, each helping to correct mistakes made by the others, making the overall prediction stronger and more accurate. Known for its efficiency and scalability in handling large datasets, LGBM incorporates two notable techniques (Ke et al., 2017): Gradient-based one-sided sampling (GOSS) and exclusive feature bundling (EFB). GOSS improves the training process by focusing on samples with higher gradients, thus prioritizing more informative updates, while EFB minimizes feature redundancy, addressing the limitations of histogram-based GBDT frameworks. Together, these innovations make LGBM a robust choice for high-dimensional data. The mathematical analysis in GOSS is shown:
(1) where Vj(d) represents the estimated variance gain over the subset A ∪ B, with and , and similarly, and , the coefficient serves to normalize the sum of gradients in subset B to match the size of Ac. Therefore, the estimated is used on a reduced subset of instances, rather than the exact Vj(d) calculated over the entire instance set, to determine the optimal split point.
LGBM applies Exclusive Feature Bundling (EFB) to reduce model complexity by combining mutually exclusive features into one.
Although LGBM inherently addresses class imbalance via gradient-based one-side sampling (GOSS), we further explored additional techniques, including “SMOTE” and “ADASYN” for oversampling the minority class by generating synthetic samples, as well as adjusting class weights in the loss function to increase the model’s sensitivity to the minority class, and evaluated their impact on model performance, particularly for the minority class, compared to the standard GOSS approach.
Classifier selection: Ten machine learning classifiers, including LR, SVM, GBDT, LGBM, and RF, were selected for model construction and performance comparison. The primary goal was to assess each model’s accuracy and stability in diagnosing TPE.
Hyperparameter optimization: A combination of 10-fold and 5-fold cross-validation was used to fine-tune hyperparameters for each classifier, ensuring optimal performance on the validation set. Hyperparameter tuning focused on maximizing key metrics such as AUC, precision, and recall.
Model training: Once the optimal hyperparameters were determined, the final model was trained on the entire dataset from Cohort 1. Internal validation was conducted using Cohort 2 to confirm robustness and generalizability. The model’s performance was subsequently tested on Cohort 3 for external validation.
Model performance evaluation
The model’s performance was assessed using ROC curves and critical metrics, including specificity, sensitivity, negative predictive value (NPV), positive predictive value (PPV), F1 score, and accuracy. These metrics were calculated for internal (Cohort 2) and external (Cohort 3) validation cohorts to evaluate diagnostic accuracy comprehensively. The LGBM model achieved the highest AUC of 0.9454 during internal validation, indicating superior performance.
Assessment metrics for a diagnostic model
Precision and F1 scores serve as fundamental metrics for assessing the efficacy of machine learning algorithms. The equations that characterize these metrics are presented below.
Precision (P) quantifies the effectiveness of the model in accurately detecting tuberculous pleural effusion, whereas the F1 score serves to harmonize the metrics of precision and recall, with elevated F1 scores signifying superior model efficiency. True positives (TP) indicate the accurate identification of tuberculous pleural effusion cases, while false positives (FP) pertain to instances that have been incorrectly labeled as tuberculous pleural effusion. Additionally, false negatives (FN) represent genuine occurrences of tuberculous pleural effusion that the model was unable to recognize. These metrics similarly apply to non-tuberculous pleural effusion cases.
True negatives (TN), FN, false positives (FP), and true positives (TP) serve as crucial indicators in the evaluation of classification models. These metrics assess distinct aspects of model performance and yield important insights into accuracy, precision, and overall effectiveness across various categories. By examining these indices in conjunction—namely sensitivity, specificity, positive predictive value (PPV), and negative predictive value (NPV)—one can attain a holistic understanding of the model’s performance and its appropriateness for specific applications. Such metrics are indispensable for gauging the efficacy of classification models, offering significant insights into their performance across diverse scenarios (Yao et al., 2024).
Model comparison: Performance across classifiers was evaluated using 5-fold cross-validation, with the Wilcoxon signed-rank test employed to compare receiver operating characteristic (ROC) curves between models. LGBM consistently outperformed other classifiers, particularly in TPE diagnosis, demonstrating higher sensitivity and specificity.
Final model determination: LGBM was selected as the final model based on performance evaluation. It demonstrated predictive solid capabilities across various feature sets and effectively handled high-dimensional and imbalanced data. The top 11 features, identified based on their contributions to the model, were retained for final model construction. LGBM outperformed other models in critical metrics such as AUC, sensitivity, and specificity, establishing it as the preferred model for noninvasive TPE diagnosis.
Model interpretability: SHAP values were applied to enhance the clinical interpretability (Bau et al., 2017; Lei et al., 2022) of the LGBM model by illustrating how individual features influenced predictions. Feature importance rankings were generated, with the top 18 features highlighted. Additionally, force plots were used to examine the importance of local features for specific cases, providing clinicians with a clearer understanding of the model’s decision-making process.
Statistical analysis
Data handling and feature selection: Data were initially extracted from electronic medical records, including 20 routine laboratory parameters such as pleural fluid cell classification, ADA, ESR, pleural fluid glucose, and protein levels. The feature selection process first employed Spearman correlation analysis to address multicollinearity. When the correlation coefficient between the two features exceeded 0.6, the feature with a weaker correlation to the outcome was removed. Following this, based on feature importance analysis and model performance, 18 key features were retained (e.g., pleural fluid cell classification, ADA), while lymphocyte and macrophage proportions were excluded to avoid overfitting. Features with a missing rate above 25% were discarded, and for those with minimal missing data, median imputation was applied to minimize bias.
All analyses were conducted using Python 3.6 and R 4.1.0. Categorical variables are reported as frequencies and percentages, and continuous variables as medians with interquartile ranges. Group comparisons used the chi-square or Fisher’s exact test for categorical variables and the Mann-Whitney U or Kruskal-Wallis H test for continuous variables. Model performance comparisons were carried out using the DeLong non-parametric method, and the significance of differences in AUC values was assessed using MedCalc software. A P-value < 0.05 was considered statistically significant.
Results
Baseline analysis
This study evaluated a machine learning-based predictive diagnostic model for identifying TPE. The clinical characteristics and outcomes for the 963 patients, categorized as TPE and non-TPE, are summarized in Table 1. A total of 763 patients were randomly divided into training and internal validation sets in a 4:1 ratio. In comparison, an external cohort of 200 patients with pleural effusion was used for external validation (Table 2 compares clinical variables across these cohorts). The study design is detailed in Fig. 1.
| Variables | Non-tuberculous pleural effusion (n = 539) Mean (P25, P75)/Mean (SD) |
Tuberculous pleural effusion (n = 424) Mean (P25, P75)/Mean (SD) |
z/t | P value |
|---|---|---|---|---|
| Male1, n (%)/Female, n (%) | 331 (61%)/208 (39%) | 294 (69%)/130 (31%) | – | – |
| Age (year) | 72 (58, 80) | 56 (31, 74) | −10.14 | <0.001 |
| Nucleated Cell Count (cells/µL) | 380 (120, 1,369) | 1,837 (906, 3,360) | −12.81 | <0.001 |
| Eosinophil (%) | 11.05 (5.00, 37.93) | 4.65 (1.90, 14.45) | −8.71 | <0.001 |
| TB-Ab | 0.00 (0.00, 0.00) | 1.00 (0.00, 2.00) | −16.81 | <0.001 |
| ESR (mm/h) | 12.00 (5.00, 28.00) | 26.00 (11.0, 52.00) | −8.09 | <0.001 |
| ADA (U/L) | 5.80 (3.00, 12.00) | 40.40 (22.33, 54.93) | −20.89 | <0.001 |
| Glucose (mmol/L) | 7.23 (5.81, 9.26) | 5.71 (4.47, 6.98) | −10.18 | <0.001 |
| Chloride (mmol/L) | 103.80 (99.83, 108.40) | 101.10 (98.18, 104.21)) | −8.03 | <0.001 |
| LDH (U/L) | 135.80 (82.00, 288.00) | 399.20 (221.10, 655.25) | −13.23 | <0.001 |
| Protein (mg/dL) | 32.40 (19.70, 52.50) | 46.25 (39.13, 51.60) | −8.17 | <0.001 |
| APF (ug/L) | 1.90 (1.34, 2.89) | 1.69 (1.11, 2.57) | −3.59 | <0.001 |
| CEA (ug/L) | 2.54 (1.59, 4.00) | 1.49 (0.98, 2.17) | −11.61 | <0.001 |
| CA125 (U/ml) | 52.00 (21.90, 120.80) | 75.25 (27.50, 164.28) | −3.59 | <0.001 |
| CA199 (U/mL) | 10.04 (4.80, 20.50) | 4.22 (2.00, 9.21) | −10.39 | <0.001 |
| CA153 (U/mL) | 10.29 (6.96, 16.03) | 13.15 (8.30, 19.08) | −5.01 | <0.001 |
| CK19 (ng/mL) | 2.89 (1.80, 5.10) | 1.60 (1.10, 2.20) | −13.64 | <0.001 |
| SCC (ng/mL) | 1.10 (0.60, 2.40) | 0.70 (0.50, 0.90) | −9.610 | <0.001 |
| Lymphocyte (%) | 33.34 (13.35, 42.00) | 90.54 (81.27, 93.20) | −23.59 | <0.001 |
| Macrophage (%) | 31.05 (11.78, 47.74) | 4.76 (4.29, 4.91) | −22.84 | <0.001 |
Note:
The Z-value in non-parametric tests quantifies how much the distributions of the two groups differ from the null hypothesis. Its magnitude and direction indicate the significance and trend of the difference.
| Variables | Training (n = 610) | Internal validation (n = 153) | External validation (n = 200) | P |
|---|---|---|---|---|
| Male, n (%)/Female, n (%) | 411 (67%)/199 (33%) | 96 (63%)/57 (37%) | 117 (59%)/83 (41%) | – |
| Tuberculous, n (%) | 310 (50.82%) | 73 (47.71%) | 41 (20.50%) | – |
| Age (years) | 66.50 (47.00, 77.00) | 66.00 (47.00, 77.50) | 67.00 (48.50, 77.00) | 0.991 |
| Nucleated cell count (cells/µL) | 1,059.00 (296.75, 2,758.00) | 1,330.00 (272.00, 3,004.50) | 1,064 (211, 2,979) | 0.786 |
| Eosinophil, (%) | 6.00 (2.28, 20.75) | 8.50 (2.45, 30.20) | 6.00 (2.05, 22.25) | 0.226 |
| TB-Ab | 0.00 (0.00, 1.00) | 0.00 (0.00, 0.50) | 0.00 (0.00, 2.00) | 0.230 |
| ESR (mm/h) | 20 (6, 43) | 20.00 (6.50, 44.00) | 17.00 (4.50, 42.00) | 0.318 |
| ADA, (U/L) | 20.00 (6.80, 43.70) | 16.10 (5.60, 43.00) | 11.70 (4.00, 38.95) | 0.140 |
| Glucose, (mmol/L) | 6.24 (4.86, 7.74) | 6.41 (4.95, 7.54) | 6.86 (5.15, 8.44) | 0.126 |
| Chloride, (mmol/L) | 102.14 (98.76, 105.80) | 102.04 (98.71, 105.27) | 102.60 (99.83, 106.24) | 0.489 |
| LDH, (U/L) | 250.55 (125.40, 581.70) | 276.20 (114.25, 647.80) | 183.00 (102.00, 456.75) | 0.213 |
| Protein, (mg/dL) | 39.70 (25.00, 48.53) | 38.70 (24.50, 47.15) | 35.60 (21.85, 47.50) | 0.362 |
| APF, (ug/L) | 1.83 (1.25, 2.71) | 1.70 (1.10, 2.50) | 1.77 (1.23, 2.72) | 0.540 |
| CEA, (ug/L) | 1.85 (1.13, 2.89) | 1.90 (1.01, 2.89) | 1.93 (1.38, 3.35) | 0.348 |
| CA125, (U/ml) | 67.30 (26.17, 158.51) | 60.70 (24.30, 122.65) | 58.54 (25.40, 139.43) | 0.354 |
| CA199, (U/mL) | 6.36 (2.88, 14.09) | 4.95 (2.58, 14.10) | 6.28 (2.17, 16.98) | 0.470 |
| CA153, (U/mL) | 12.01 (7.50, 18.53) | 11.16 (7.45, 17.60) | 11.20 (7.55, 16.15) | 0.583 |
| CK19, (ng/mL) | 1.196 (1.30, 3.20) | 1.90 (1.22, 2.94) | 2.15 (1.18, 3.80) | 0.323 |
| SCC, (ng/mL) | 0.77 (0.50, 1.20) | 0.70 (0.50, 1.30) | 0.80 (0.50, 1.20) | 0.961 |
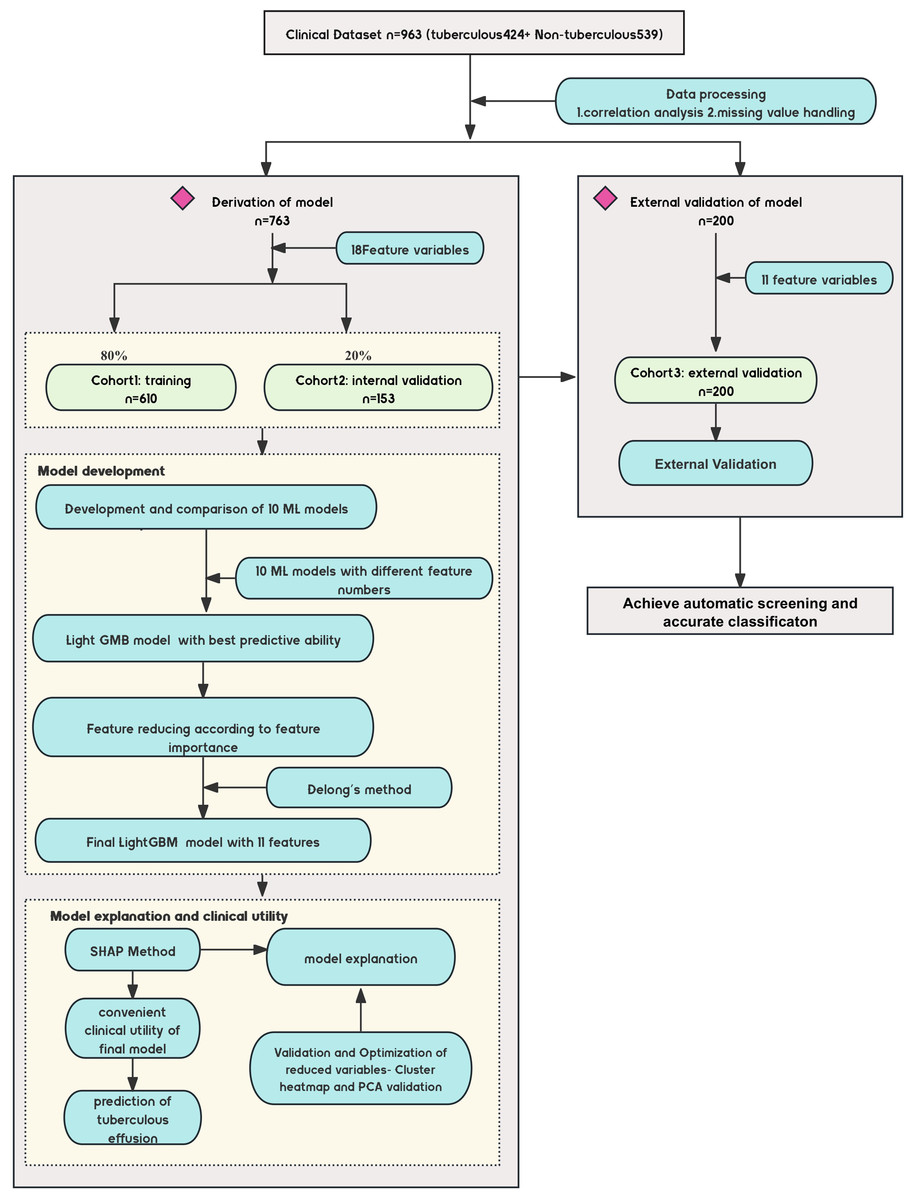
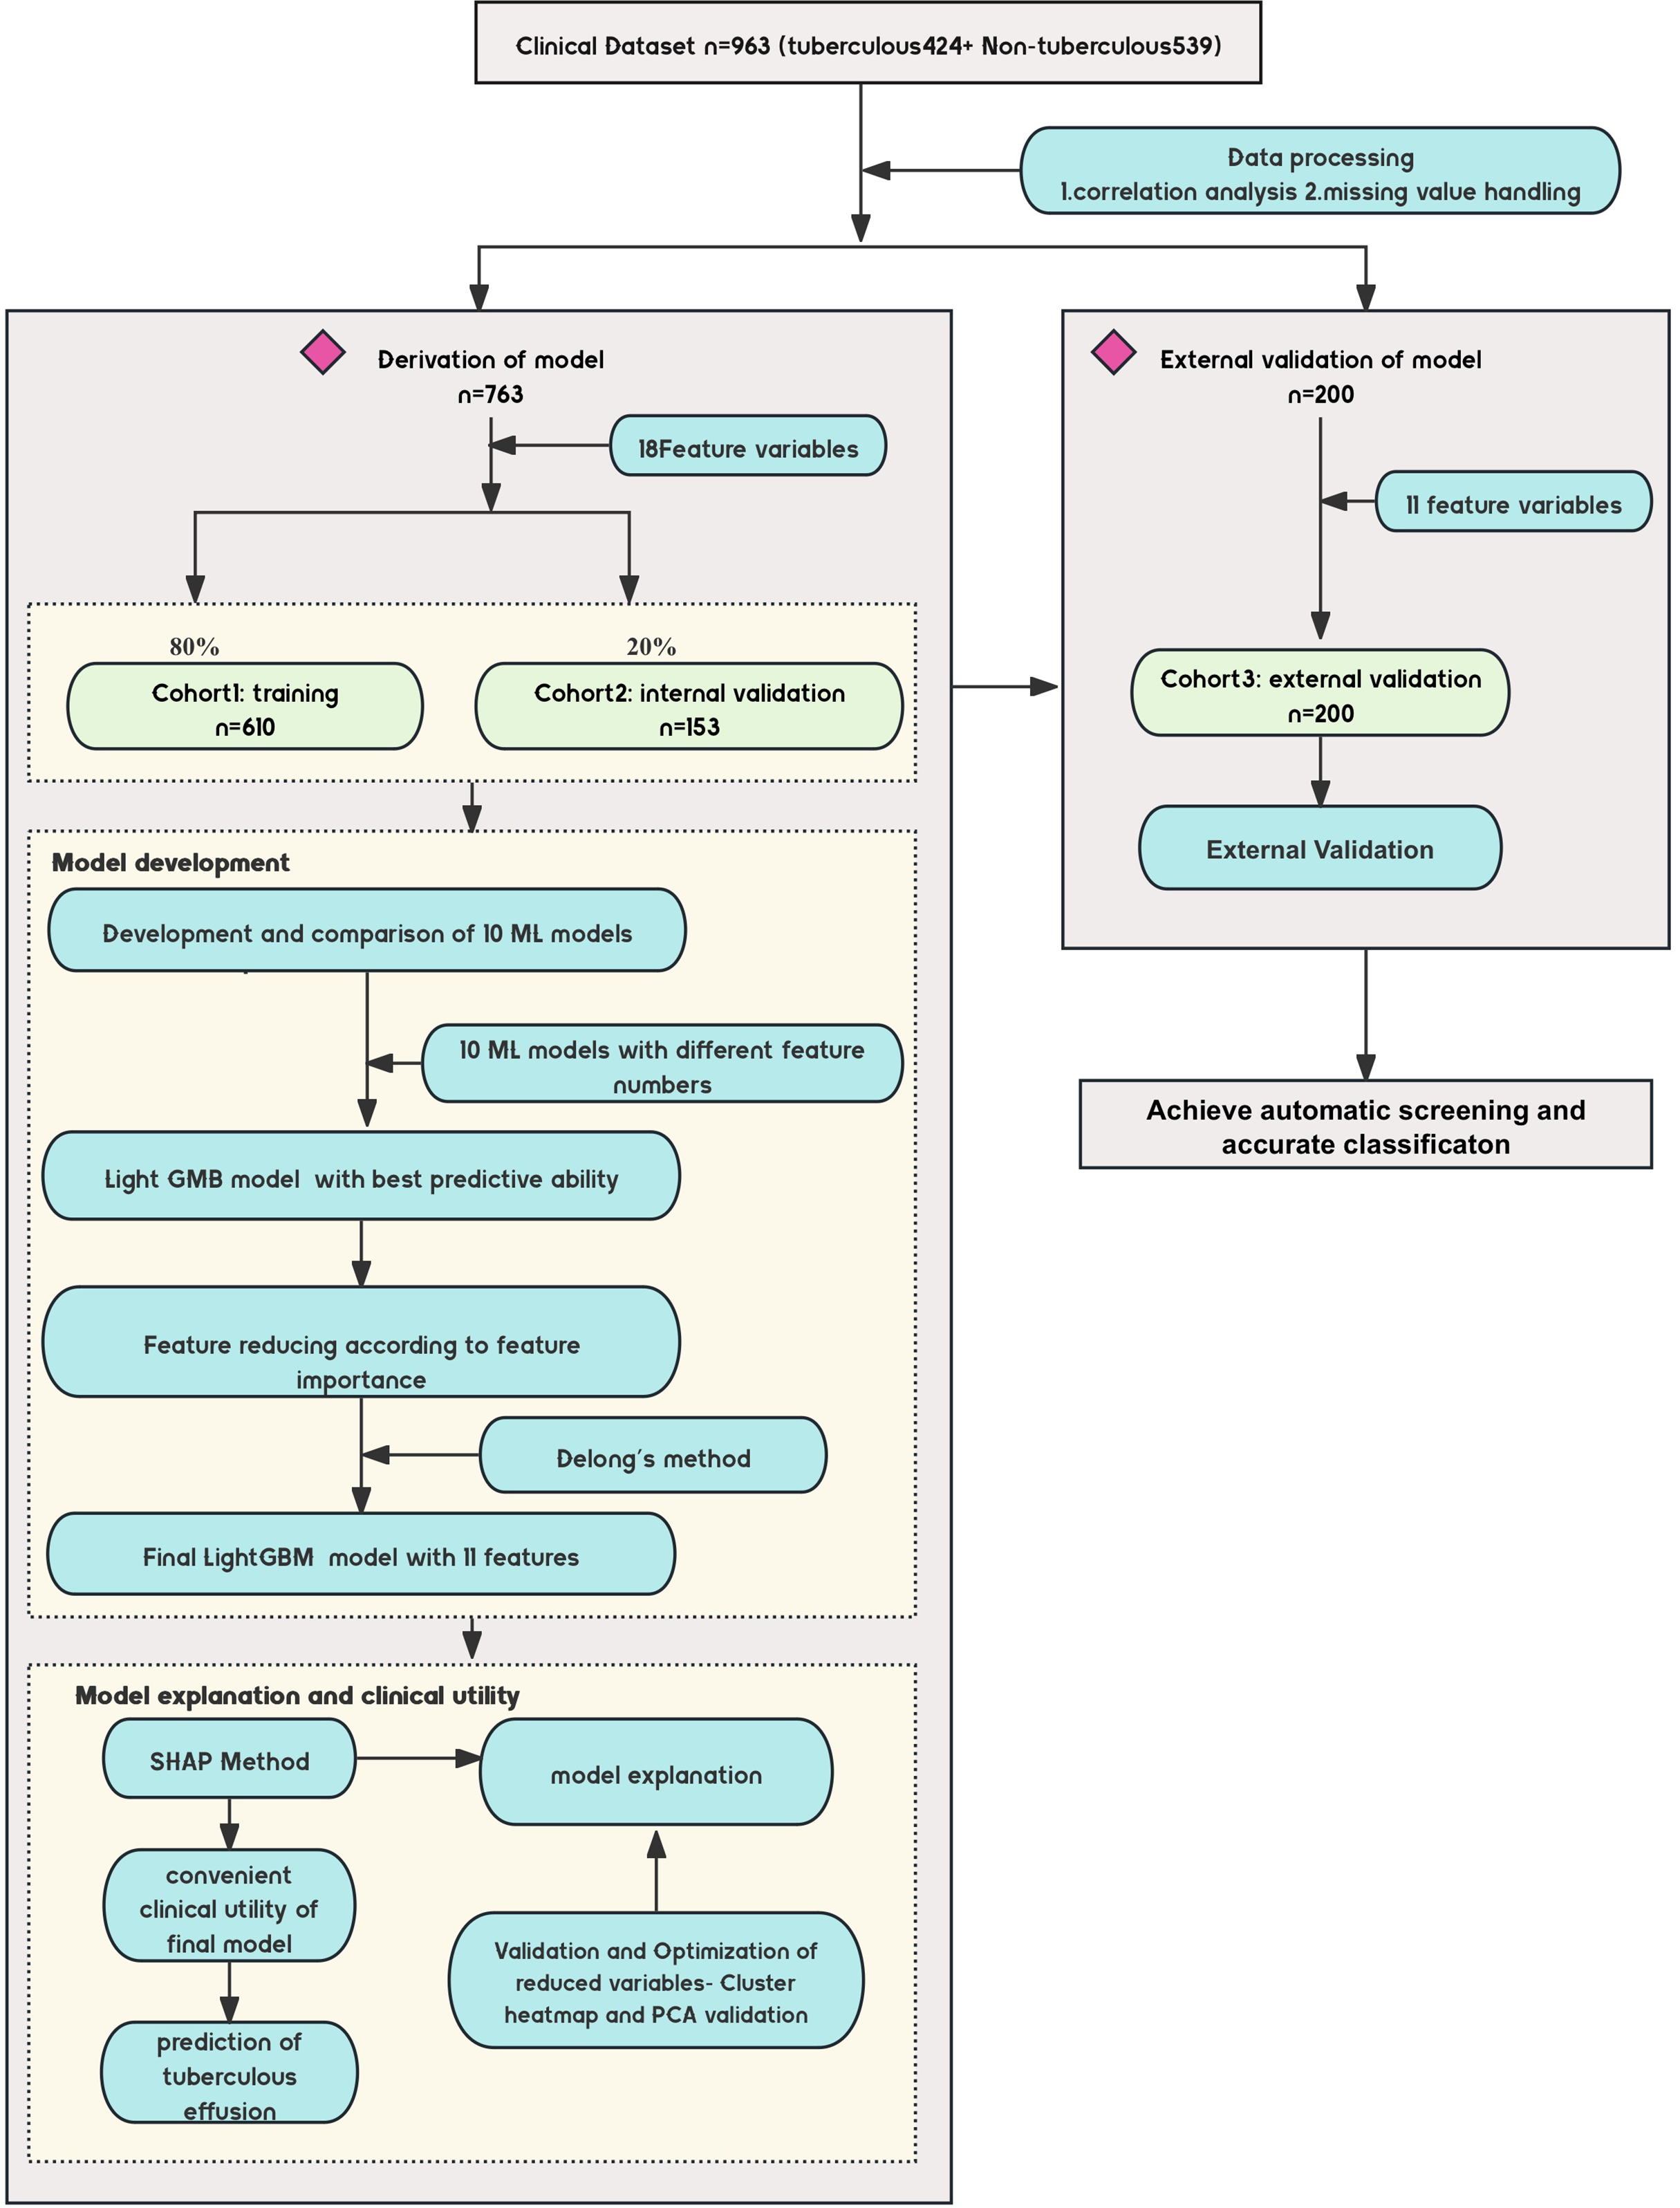
Figure 1: Diagram of the study design.
Design of the study, including the data sources, participant inclusion criteria, and the workflow for model development. The study involved multiple medical centers across China, with a focus on noninvasive tuberculous pleural effusion diagnosis using machine learning (ML) and SHAP analysis. ML, machine learning; SHAP, Shapley Additive exPlanations; LGBM, light gradient boosting machine.The Z-value in non-parametric tests quantifies how much the distributions of the two groups differ from the null hypothesis. Its magnitude and direction indicate the significance and trend of the difference.
Model development and performance comparison
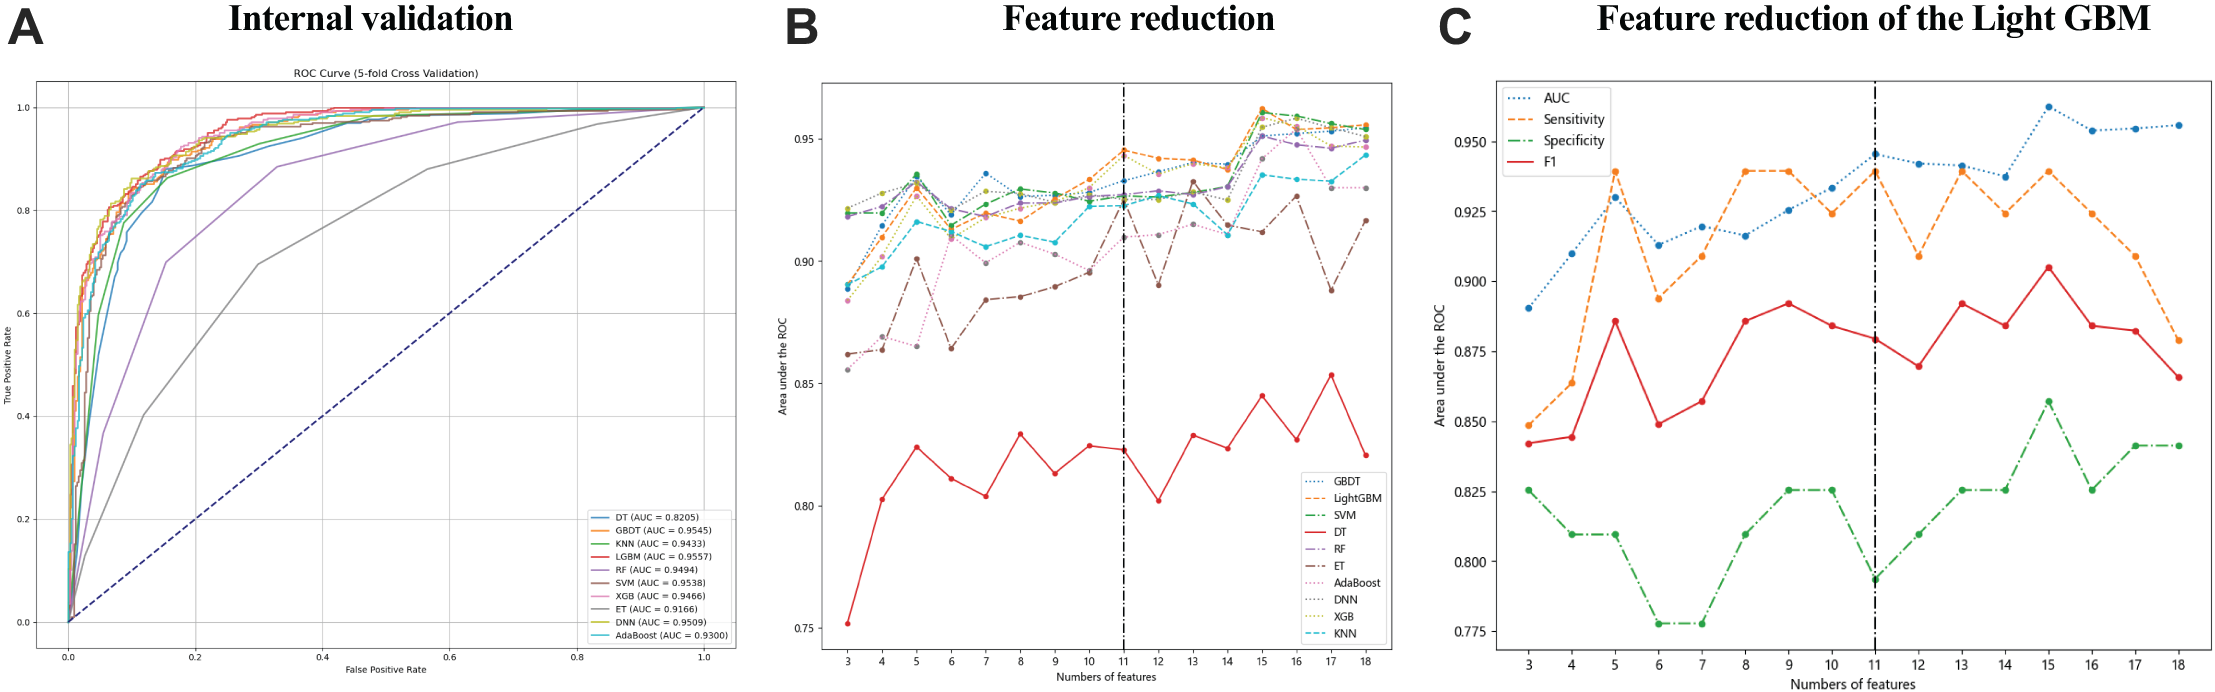
Data collected within the first 24 h of patient admission with pleural and peritoneal effusion were used to develop 10 ML models to predict tuberculous effusion. The LGBM model outperformed others with an AUC of 0.9557, followed closely by GBDT (AUC = 0.9545) and SVM (AUC = 0.9538). Table 3 summarizes the model performances, and Fig. 2A presents the ROC curves for models, all utilizing 18 features. During feature reduction, LGBM maintained superior predictive ability, as shown in Fig. 2B. Consequently, LGBM demonstrated the highest predictive accuracy among all models. The LGBM model significantly outperformed other machine learning models in this study, as summarized in Table 3. During internal validation, LGBM achieved the highest AUC of 0.9557, surpassing models like random forest (AUC = 0.9494) and GBDT (AUC = 0.9545), demonstrating superior diagnostic accuracy. Additionally, LGBM exhibited improved sensitivity and specificity, particularly when handling high-dimensional and imbalanced datasets, indicating greater robustness. The comparative performances of these models are visually depicted in Figs. 2A and 2B, further highlighting LGBM’s suitability for noninvasive clinical diagnostics.
| Models | AUC | Sensitivity | Specificity | PPV | NPV | Accuracy | F1 score |
|---|---|---|---|---|---|---|---|
| LGBM | 0.9557 | 0.8788 | 0.8412 | 0.8689 | 0.8529 | 0.8605 | 0.8657 |
| GBDT | 0.9545 | 0.8728 | 0.8538 | 0.8557 | 0.8711 | 0.8617 | 0.8624 |
| SVM | 0.9538 | 0.8514 | 0.8797 | 0.8762 | 0.8555 | 0.8620 | 0.8636 |
| DNN | 0.9509 | 0.8579 | 0.9008 | 0.8958 | 0.8642 | 0.8794 | 0.8762 |
| RF | 0.9494 | 0.7685 | 0.9009 | 0.8865 | 0.7953 | 0.8345 | 0.8226 |
| XGB | 0.9466 | 0.8774 | 0.8538 | 0.8571 | 0.8744 | 0.8655 | 0.8671 |
| KNN | 0.9433 | 0.8628 | 0.8461 | 0.8472 | 0.8615 | 0.8534 | 0.8537 |
| AdaBoost | 0.9300 | 0.8726 | 0.8632 | 0.8645 | 0.8714 | 0.8679 | 0.8685 |
| ET | 0.9166 | 0.6950 | 0.7013 | 0.6969 | 0.6972 | 0.6981 | 0.6994 |
| DT | 0.8205 | 0.8463 | 0.8439 | 0.8435 | 0.8466 | 0.8451 | 0.8446 |
Note:
The indexes represent the performance of ML models in the internal validation cohort. AUC, area under the receiver-operating-characteristic curve; LGBM, Light Gradient Boosting Machine; GBDT, Gradient Boosting Decision Trees; SVM, Support Vector Machine; DNN, Deep Neural Network; RF, Random Forest; XGB, Extreme Gradient Boosting; KNN, K-Nearest Neighbors; AdaBoost, Adaptive Boosting; ET, Extra Trees; DT, Decision Tree.
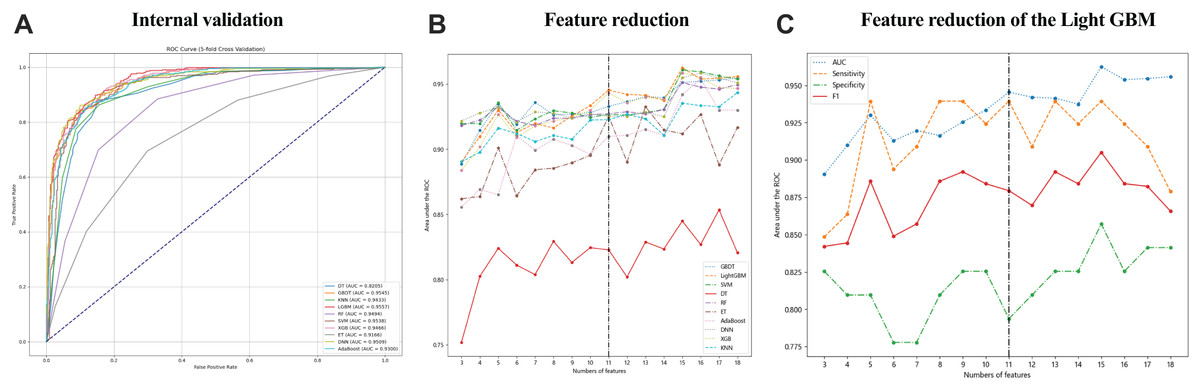
Figure 2: The performance of the ML models in predicting tuberculous pleural effusion.
(A) shows the ROC curves for 10 different machine learning models used to predict TPE. The LGBM model achieved the highest AUC of 0.9557, demonstrating superior performance compared to other models. (B) highlights the AUC performance of models with varying feature counts, showcasing the LGBM model’s stability and predictive accuracy with a reduced feature set. (C) Sensitivity, AUC, F1 score, and specificity for the LGBM model with varying feature sets. AUC, area under the ROC curve; LGBM, Light Gradient Boosting Machine; GBDT, Gradient Boosting Decision Trees; SVM, Support Vector Machine; DNN, Deep Neural Network; RF, Random Forest; XGB, Extreme Gradient Boosting; KNN, K-Nearest Neighbors; AdaBoost, Adaptive Boosting; ET, Extra Trees; DT, Decision Tree.LGBM model performance by feature set
Figure 2C and Table 4 detail the performance of the LGBM model across different feature sets. Specificity, sensitivity, NPV, PPV, F1 score, and accuracy were calculated at the optimal cutoff, determined by maximizing the Youden index. Table 4 details the LGBM model’s performance across different feature sets, showing how the number of features affects its diagnostic accuracy for TPE. Additionally, Table 5 provides the P-value calculations corresponding to the feature value changes and their impact on the LGBM algorithm’s performance.
| Feature numbers | AUC | Sensitivity | Specificity | F1 score | PPV | NPV | Accuracy | Precision |
|---|---|---|---|---|---|---|---|---|
| 1 | 0.8858 | 0.8788 | 0.7460 | 0.8286 | 0.8545 | 0.7838 | 0.8140 | 0.3193 |
| 2 | 0.8876 | 0.8030 | 0.8095 | 0.8092 | 0.7969 | 0.8154 | 0.8062 | 0.9014 |
| 3 | 0.8903 | 0.8485 | 0.8254 | 0.8421 | 0.8387 | 0.8358 | 0.8372 | 0.9013 |
| 4 | 0.9098 | 0.8636 | 0.8095 | 0.8444 | 0.8500 | 0.8261 | 0.8372 | 0.7098 |
| 5 | 0.9300 | 0.9394 | 0.8095 | 0.8857 | 0.9273 | 0.8378 | 0.8760 | 0.3193 |
| 6 | 0.9129 | 0.8939 | 0.7778 | 0.8489 | 0.8750 | 0.8082 | 0.8372 | 0.3840 |
| 7 | 0.9197 | 0.9091 | 0.7778 | 0.8571 | 0.8909 | 0.8108 | 0.8450 | 0.3193 |
| 8 | 0.9163 | 0.9394 | 0.8095 | 0.8857 | 0.9273 | 0.8378 | 0.8760 | 0.3193 |
| 9 | 0.9254 | 0.9394 | 0.8254 | 0.8921 | 0.9286 | 0.8493 | 0.8837 | 0.3840 |
| 10 | 0.9334 | 0.9242 | 0.8254 | 0.8841 | 0.9123 | 0.8472 | 0.8760 | 0.4559 |
| 11 | 0.9454 | 0.9394 | 0.7937 | 0.8794 | 0.9259 | 0.8267 | 0.8682 | 0.2621 |
| 12 | 0.9420 | 0.9091 | 0.8095 | 0.8696 | 0.8947 | 0.8333 | 0.8605 | 0.4559 |
| 13 | 0.9413 | 0.9394 | 0.8254 | 0.8921 | 0.9286 | 0.8493 | 0.8837 | 0.3840 |
| 14 | 0.9375 | 0.9242 | 0.8254 | 0.8841 | 0.9123 | 0.8472 | 0.8760 | 0.4559 |
| 15 | 0.9625 | 0.9394 | 0.8571 | 0.9051 | 0.9310 | 0.8732 | 0.8992 | 0.5346 |
| 16 | 0.9538 | 0.9242 | 0.8254 | 0.8841 | 0.9123 | 0.8472 | 0.8760 | 0.4559 |
| 17 | 0.9545 | 0.9091 | 0.8413 | 0.8824 | 0.8983 | 0.8571 | 0.8760 | 0.6195 |
| 18 | 0.9557 | 0.8788 | 0.8413 | 0.8657 | 0.8689 | 0.8529 | 0.8605 | 0.8041 |
| Feature numbers | T test result | ||
|---|---|---|---|
| Statistic | P value | df | |
| 18 | 0.2483 | 0.8041 | 256.0 |
| 17 | 0.4971 | 0.6195 | 256.0 |
| 16 | 0.7468 | 0.4559 | 256.0 |
| 15 | 0.6218 | 0.5346 | 256.0 |
| 14 | 0.7468 | 0.4559 | 256.0 |
| 13 | 0.8721 | 0.3840 | 256.0 |
| 12 | 0.7468 | 0.4559 | 256.0 |
| 11 | 1.1239 | 0.2621 | 256.0 |
| 10 | 0.7468 | 0.4559 | 256.0 |
| 9 | 0.8721 | 0.3840 | 256.0 |
| 8 | 0.9978 | 0.3193 | 256.0 |
| 7 | 0.9978 | 0.3193 | 256.0 |
| 6 | 0.8721 | 0.3840 | 256.0 |
| 5 | 0.9978 | 0.3193 | 256.0 |
| 4 | 0.3726 | 0.7098 | 256.0 |
| 3 | 0.1241 | 0.9013 | 256.0 |
| 2 | −0.1240 | 0.9014 | 256.0 |
| 1 | 0.9978 | 0.3193 | 256.0 |
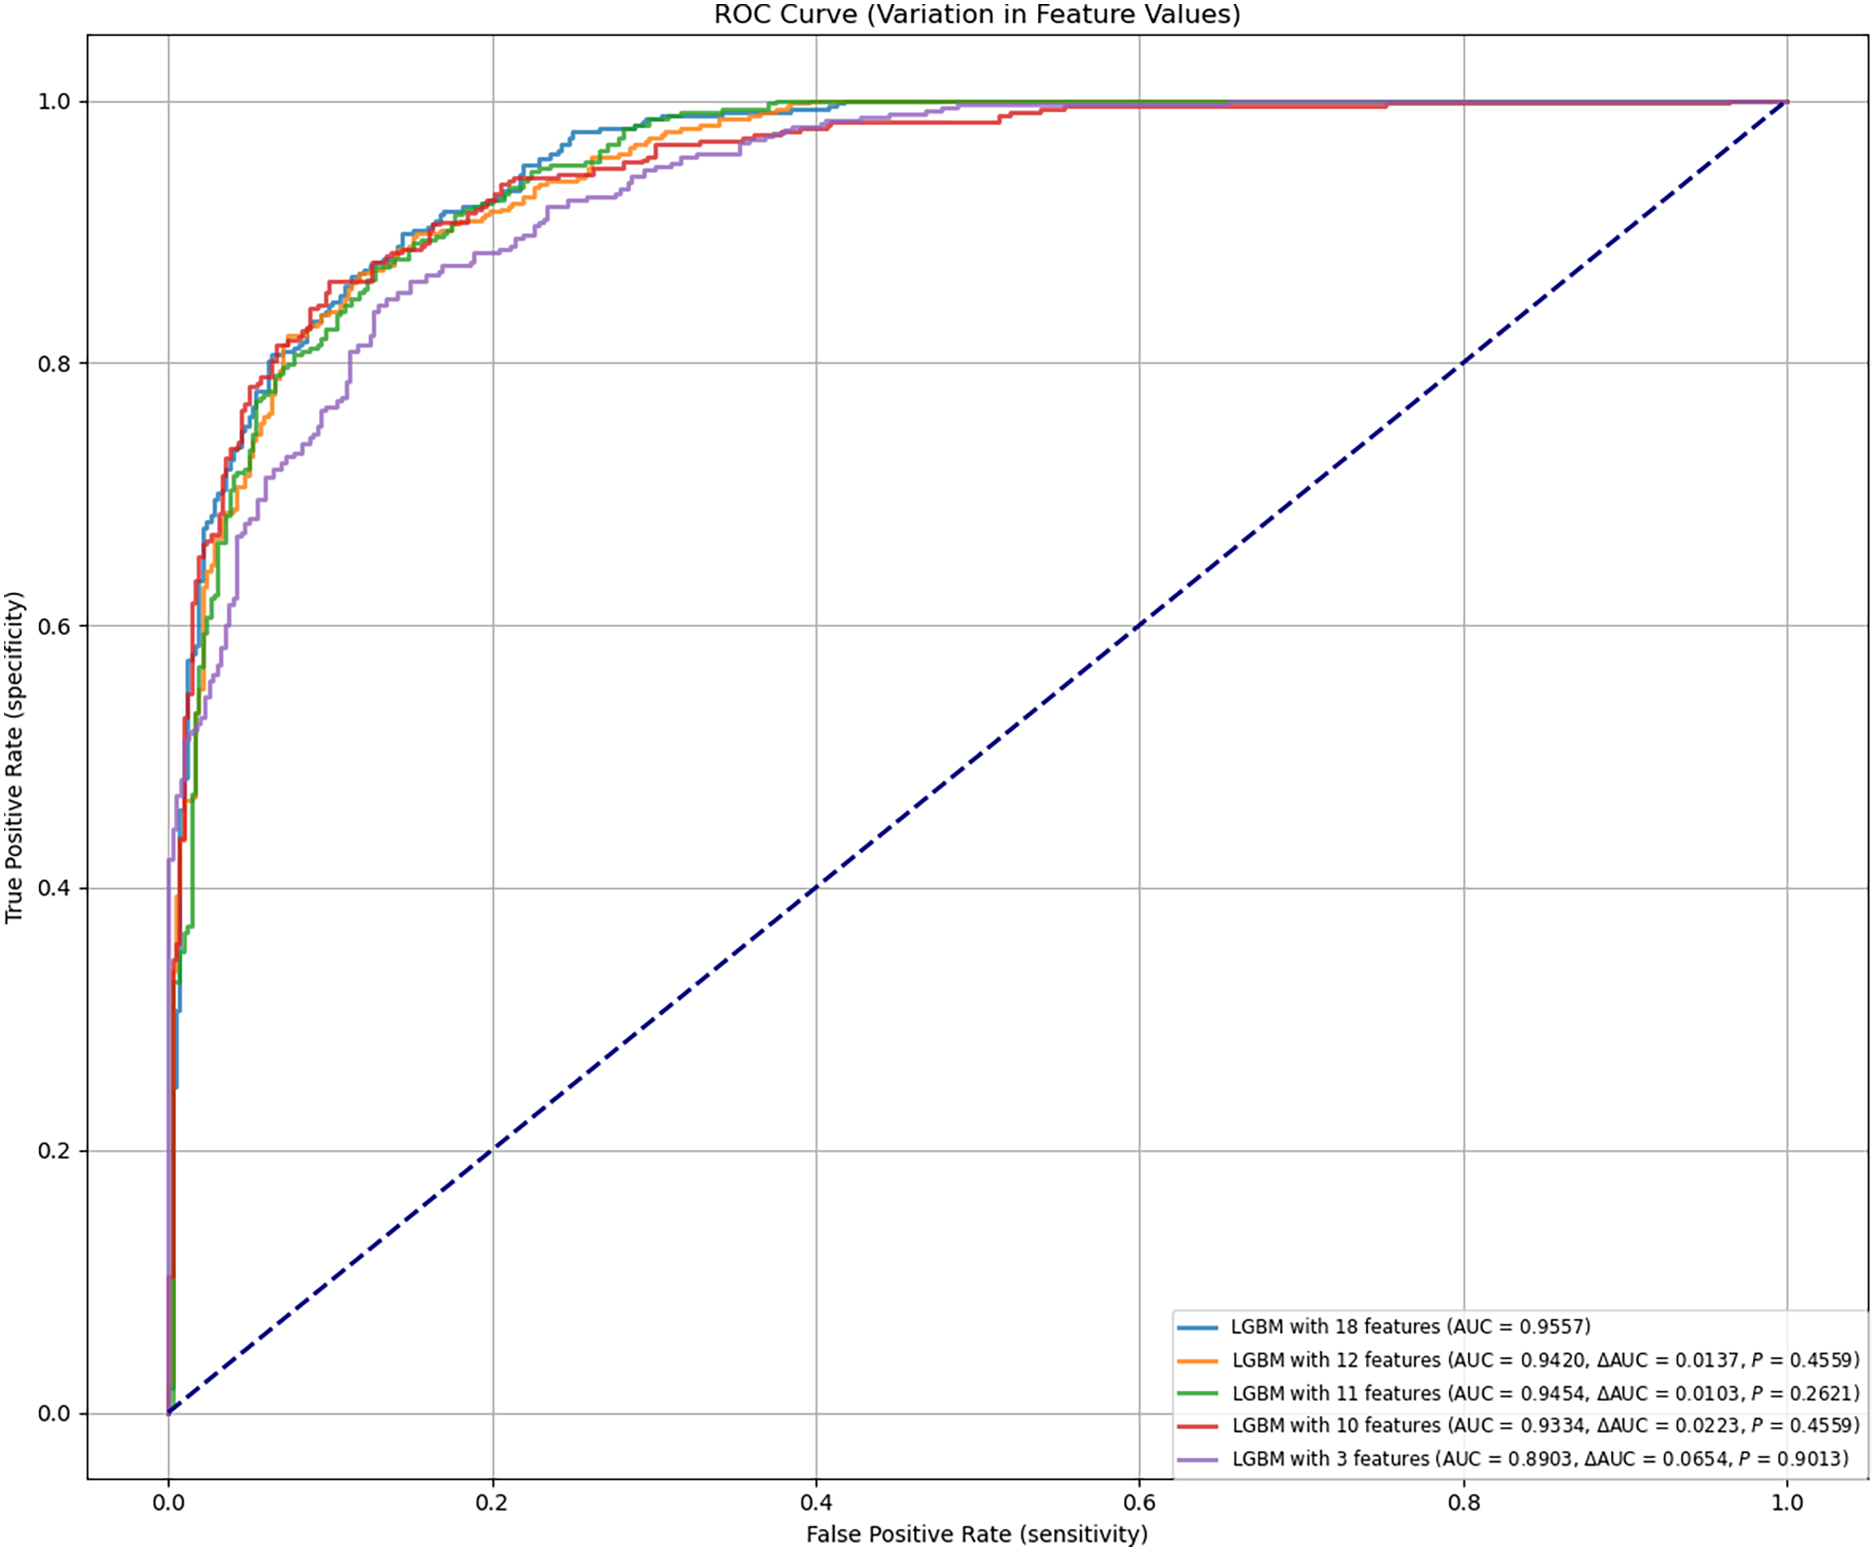
Final model identification
The final LGBM model was constructed based on selected feature parameters (see Figs. 2C and 3). The 18-feature model showed improved performance over the 10-feature (ΔAUC = 0.0223, P = 0.4559), 3-feature (ΔAUC = 0.0654, P = 0.9013), and 12-feature models (ΔAUC = 0.0137, P = 0.4559). However, its performance was not statistically superior to the 11-feature model (ΔAUC = 0.0103, P = 0.2621). As shown in Table 4, the 11-feature model exhibited similar net benefit and threshold probability as the 18-feature model, indicating equivalent clinical utility. Consequently, the 11-feature LGBM model was selected for further analysis. This model included age, eosinophil, TB-Ab, ADA, glucose, chloride, LDH, protein, CA153, CK19, and SCC. The final LGBM model achieved an accuracy of 0.8682, AUC of 0.9454, F1 score of 0.8794, sensitivity of 0.9394, specificity of 0.7937, PPV of 0.9259, and NPV of 0.8267, as detailed in Table 4. These metrics demonstrate the model’s predictive solid performance in diagnosing TPE and underscore its utility as an interpretable predictive tool for clinical application.
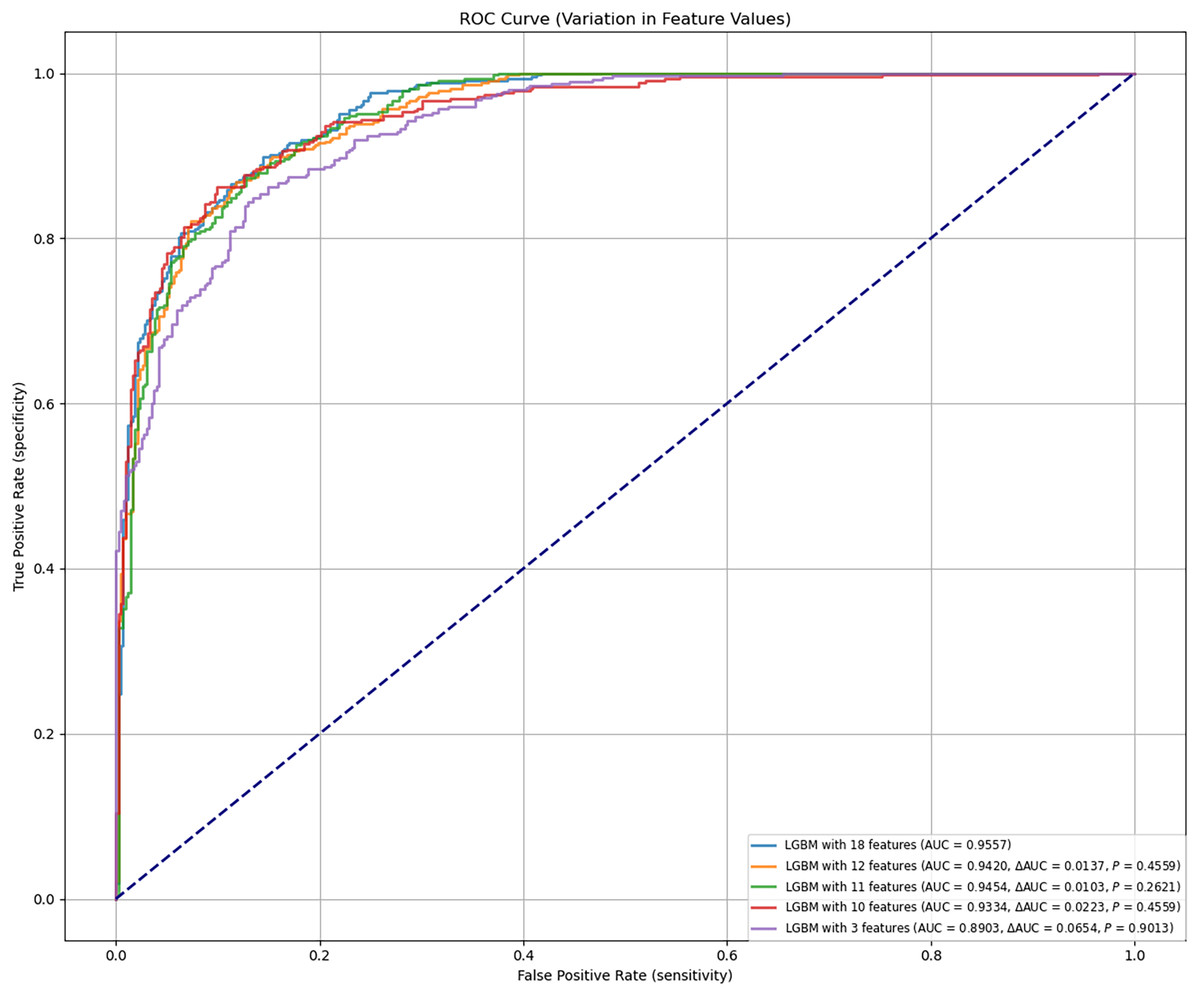
Figure 3: Predictive performance of the LGBM model after feature reduction.
This figure presents the performance of the LGBM model after reducing the number of features. The model maintains high accuracy and AUC, with feature reduction improving its diagnostic efficiency, as shown in the comparison with alternative models in Fig. 2. AUC, area under the ROC curve; ROC, receiver-operating-characteristic; LGBM, light gradient boosting machine.In the final evaluation of the LGBM model, we analyzed false positive and false negative cases, finding that false positives were mainly caused by elevated ADA and TB-Ab levels, while false negatives were common in mild TPE patients with ADA levels below the diagnostic threshold. SHAP analysis further confirmed the role of these features in misclassification. Despite the overall good performance of the model, improvements are needed in the recognition of low-expression TPE cases. To address this, we plan to enhance sensitivity for low-expression TPE cases, introduce more TPE-related features, especially for early or asymptomatic cases, and use more complex models or ensemble methods to improve performance in complex cases. These optimization measures will enhance the model’s diagnostic ability in clinical settings. Additionally, to assess the stability and reliability of the model, we calculated the confidence intervals for the AUC. The results showed that in both internal and external validation, the AUC of the LGBM model was 0.9454 and 0.9262, respectively (95% confidence intervals: [0.9400–0.9500] and [0.9200–0.9300]), further validating the model’s stability and predictive ability. To validate the advantages of the LGBM model, we compared it with traditional diagnostic methods, such as clinical evaluation, imaging, and routine laboratory tests. The LGBM model demonstrated significantly higher diagnostic sensitivity in early or asymptomatic TPE cases compared to clinical evaluation; it provided more consistent and efficient diagnoses than imaging, especially in cases with unclear images; additionally, by integrating multiple laboratory indicators, LGBM offered a more comprehensive assessment of TPE diagnosis, improving accuracy. Overall, the LGBM model excels in enhancing diagnostic sensitivity and accuracy, and is highly adaptable, especially in resource-limited areas. The LGBM model has broad clinical applicability, providing efficient diagnostic support in resource-limited hospitals, particularly improving diagnostic sensitivity in early and mild TPE cases, and it can further enhance its performance in low-expression TPE cases through feature optimization and ensemble methods in the future.
External validation and performance evaluation of feature parameters
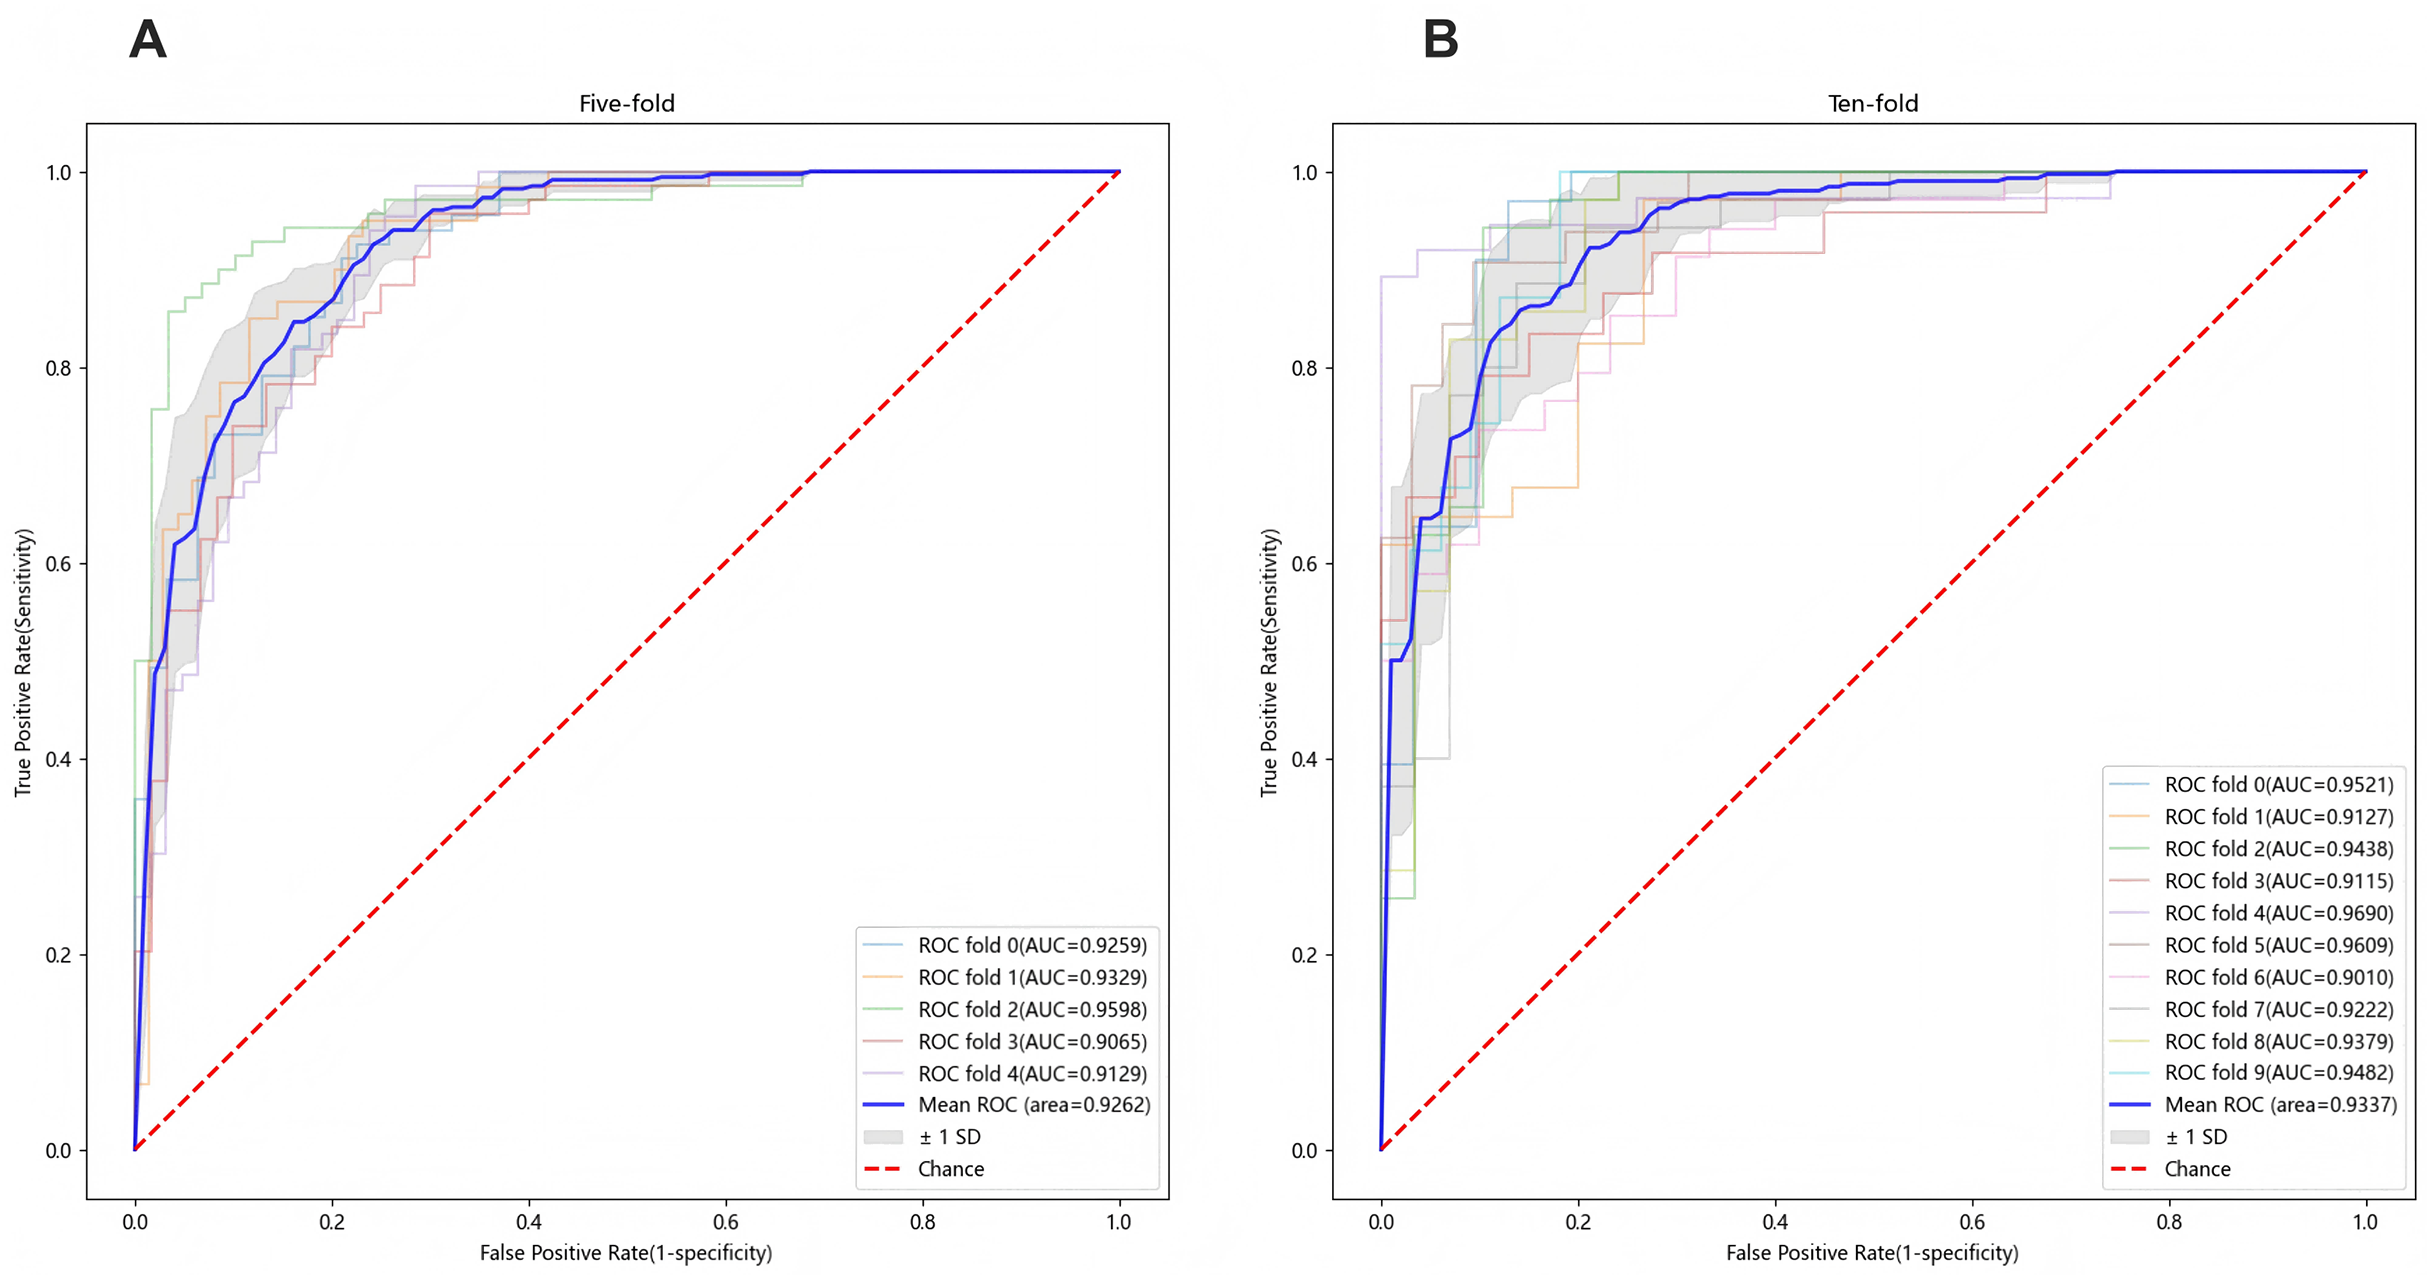
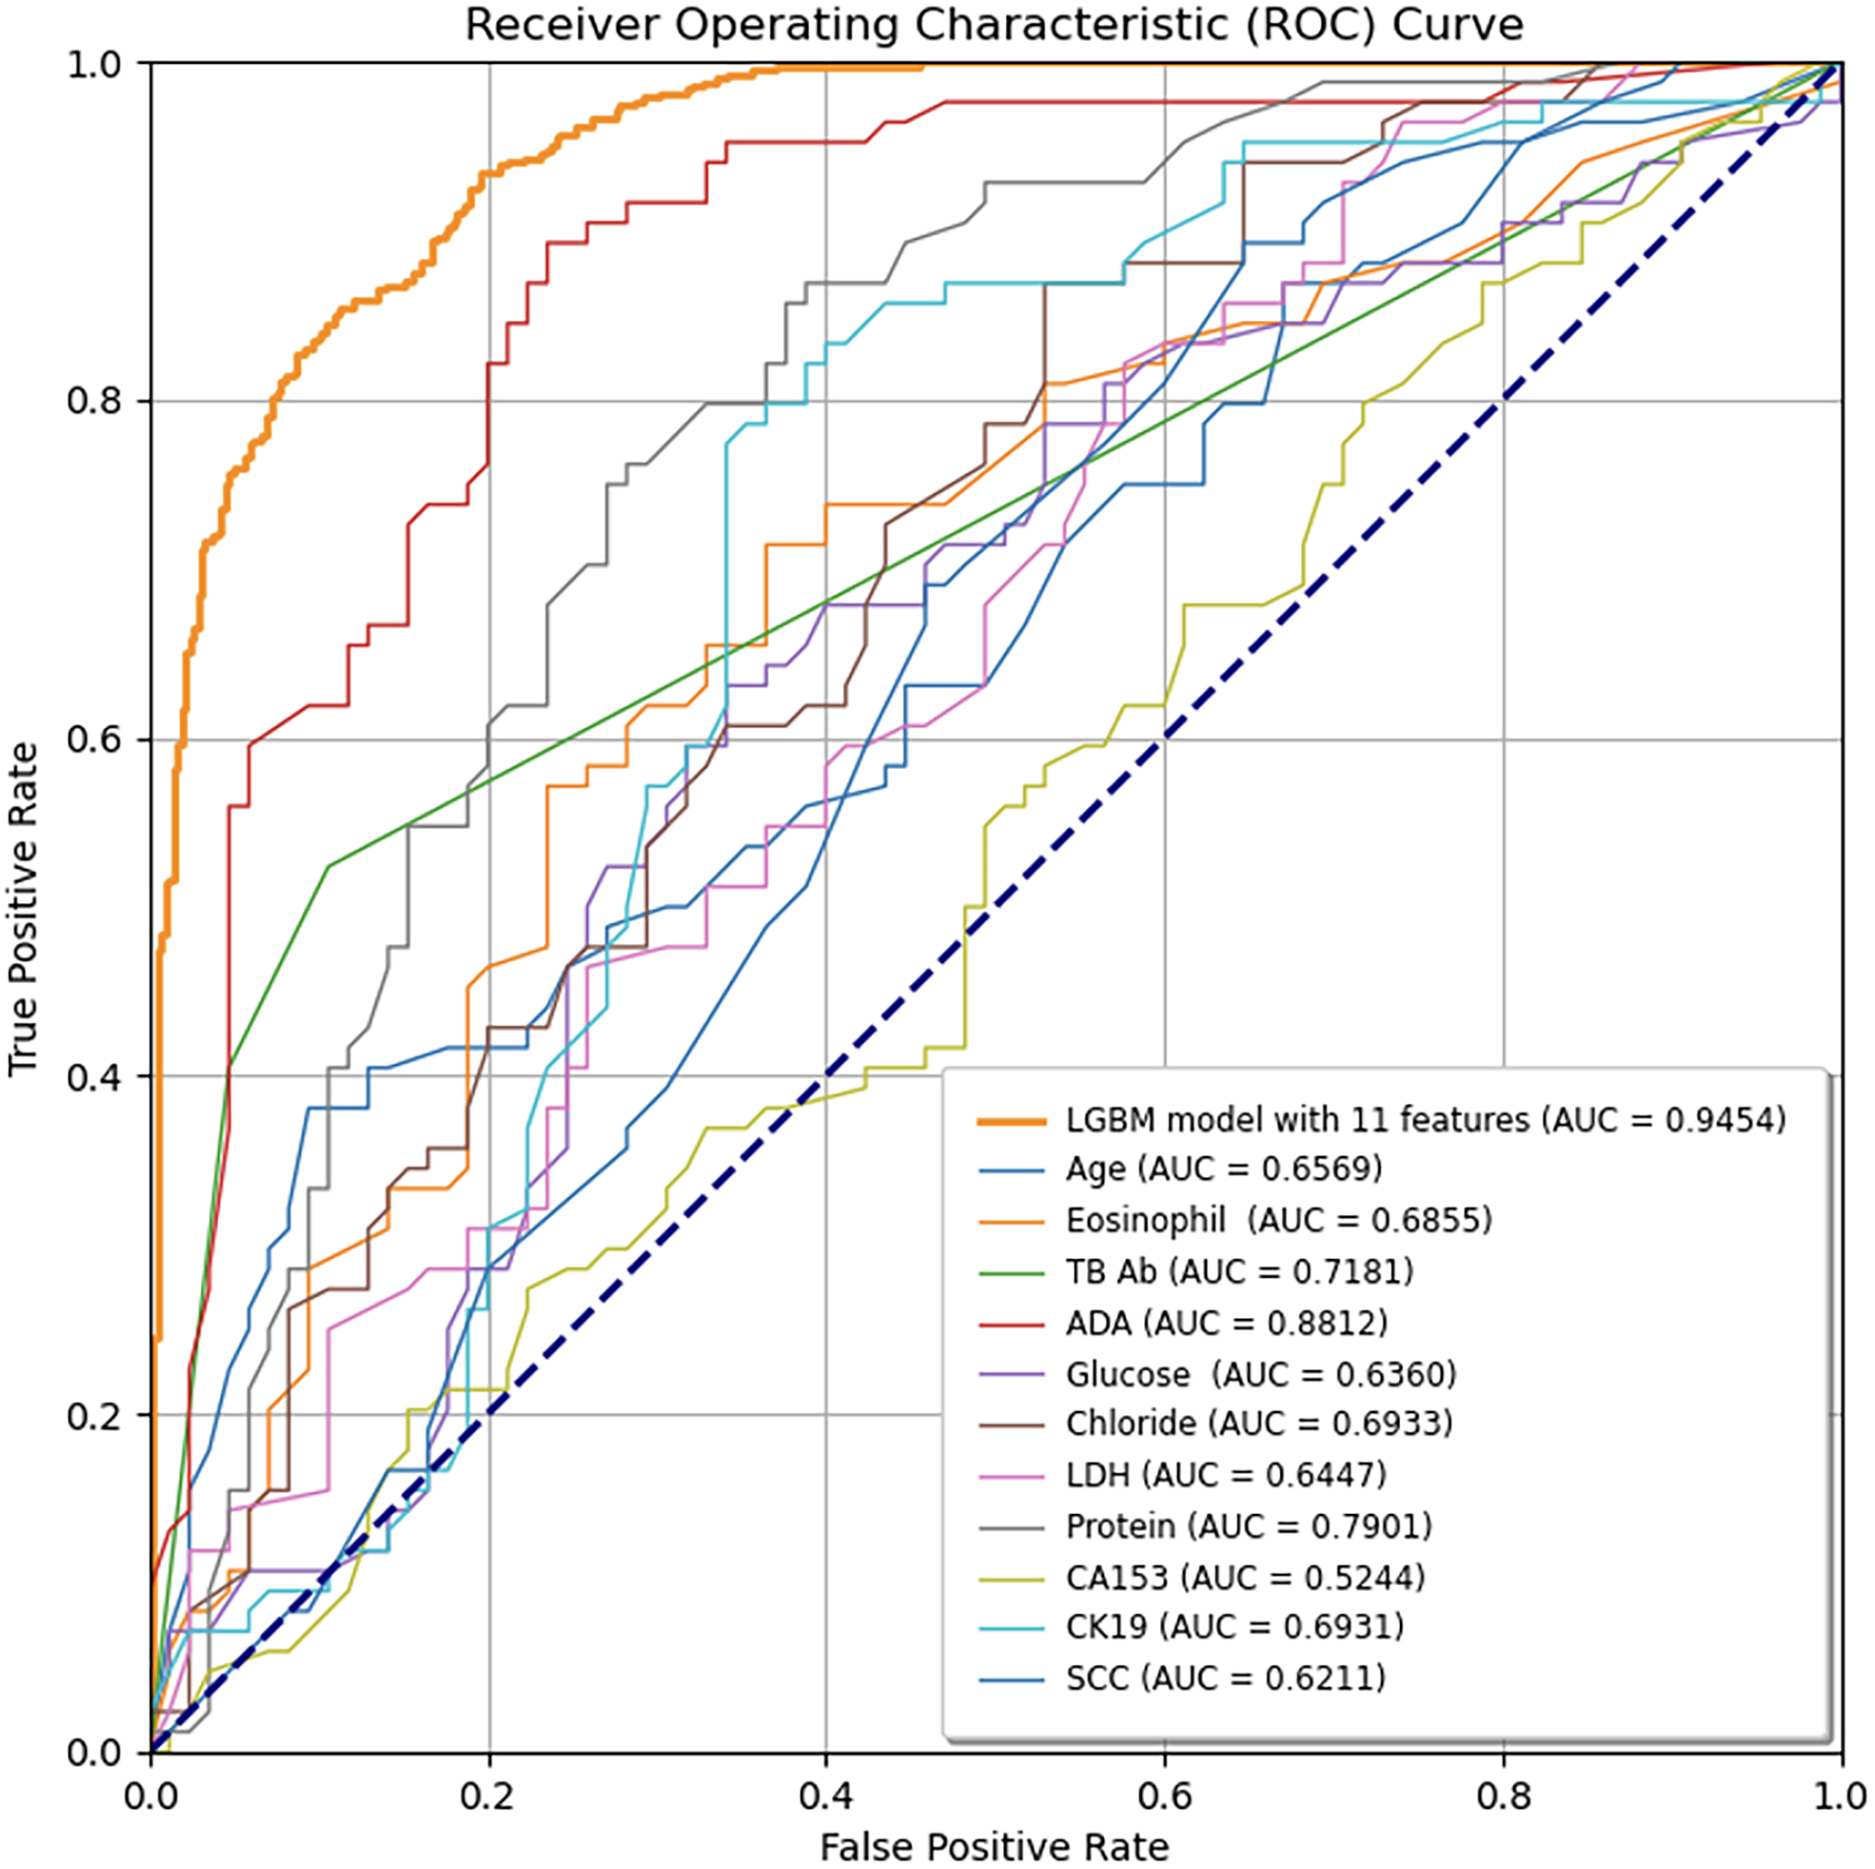
To ensure sample size adequacy and assess the impact of different sample sizes, 5-fold and 10-fold cross-validation were conducted, as presented in Figs. 4A and 4B. The final model yielded a mean AUC of 0.9262 in the 5-fold cross-validation and 0.9337 in the 10-fold cross-validation, confirming its stability and generalizability. Additionally, individual feature performance, including age, eosinophil, TB-Ab, ADA, glucose, chloride, LDH, protein, CA153, CK19, and SCC, was evaluated compared to the 11-feature model. As demonstrated in Fig. 5, the individual performance of features such as age (ΔAUC = 0.2885), eosinophil (ΔAUC = 0.2599), TB-Ab (ΔAUC = 0.2273), ADA (ΔAUC = 0.0642), glucose (ΔAUC = 0.3094), and others consistently underperformed relative to the full 11-feature model during internal validation.
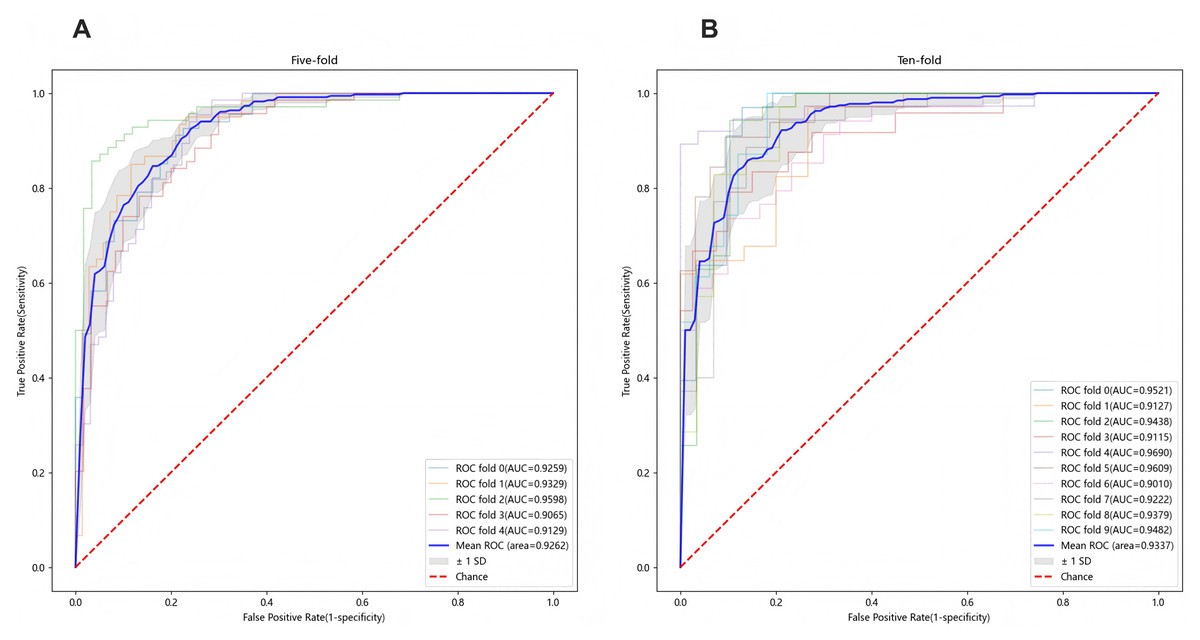
Figure 4: Predictive performance of the final LGBM model in cross-validation.
(A) Five-fold cross-validation of the final LGBM model with eleven features. (B) Ten-fold cross-validation of the final LGBM model with eleven features. These plots represent the predictive performance of the cross-validation within the derivation cohort, illustrating the model’s accuracy and robustness. Both cross-validation methods demonstrate the model’s robustness, with AUC values consistently above 0.92, confirming the model’s generalizability across different datasets. LGBM, light gradient boosting machine; AUC, area under the ROC curve; ROC, receiver-operating-characteristic; SD, standard deviation.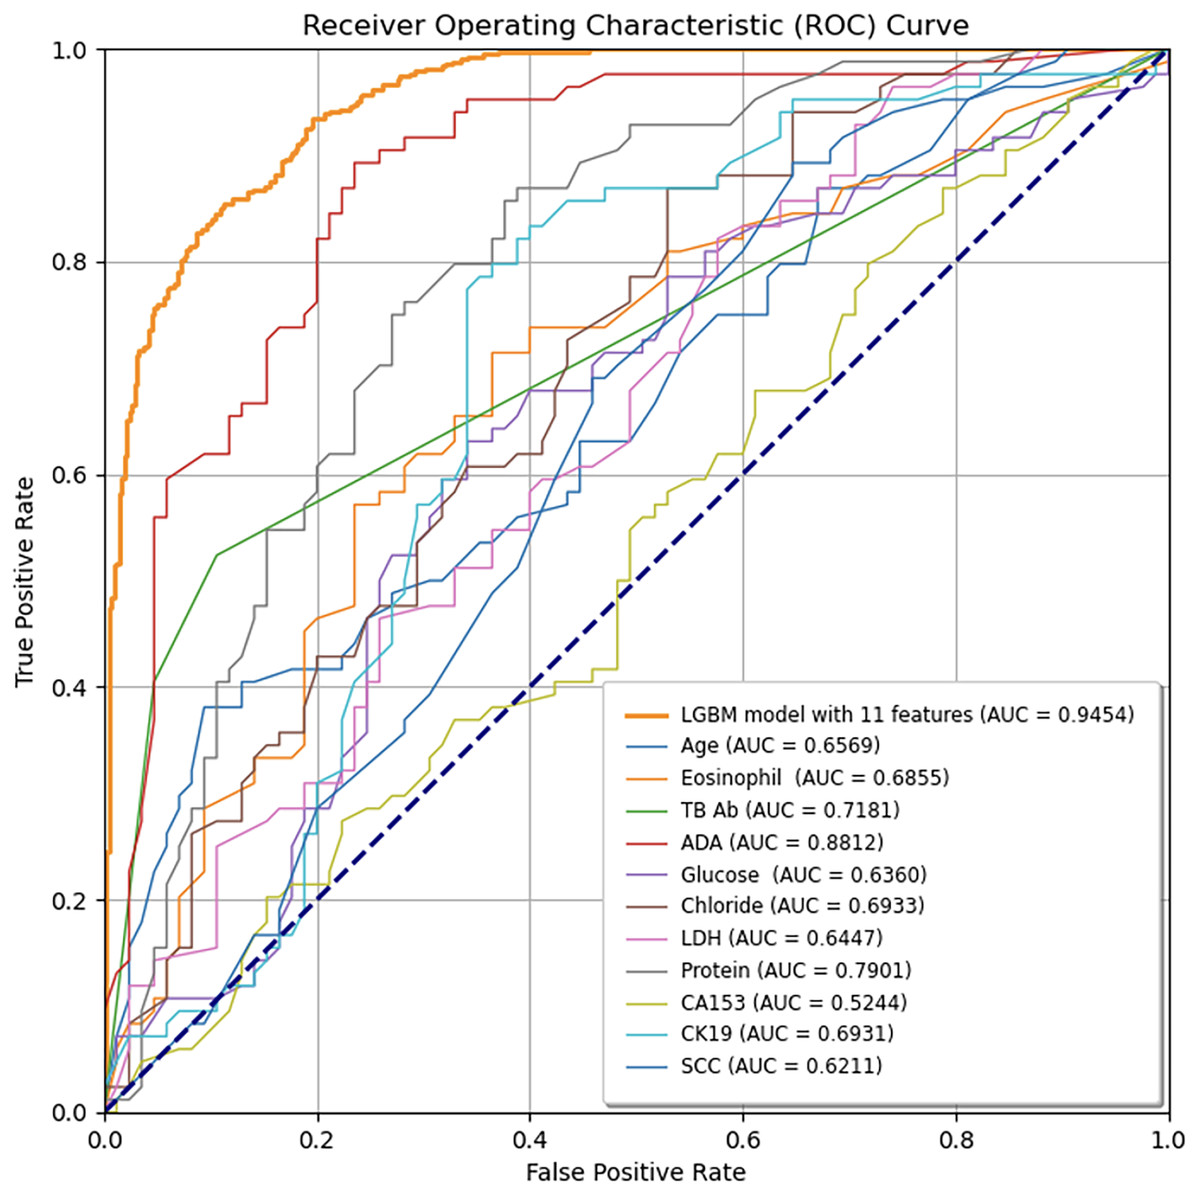
Figure 5: Comparison of ROC curves between the final LGBM model with 11 features and individual feature models.
The LGBM model incorporating 11 features consistently outperforms each feature model, as demonstrated by its higher AUC values, indicating superior diagnostic accuracy for predicting tuberculous pleural effusion. The diagonal line represents the random classification baseline (AUC = 0.50). LGBM, Light Gradient Boosting Machine; AUC, Area under the ROC curve; TB-Ab, Tuberculosis Antibody; ADA, Adenosine Deaminase; LDH, Lactate Dehydrogenase; CA153, Cancer Antigen 15-3; CK19, Cytokeratin 19; SCC, Squamous Cell Carcinoma Antigen.Model interpretability
This study evaluated the performance of multiple machine learning models, including random forest, gradient boosting decision trees (GBDT), and support vector machines (SVM). LGBM demonstrated clear advantages in managing high-dimensional data (Ke et al., 2017), addressing class imbalances, and minimizing training time. By employing gradient-based one-sided sampling (GOSS) and exclusive feature bundling (EFB), LGBM significantly reduced training time and memory usage without compromising accuracy. To further enhance model transparency, SHAP values were used, providing clear insights into the contribution of each feature to the model’s predictions.
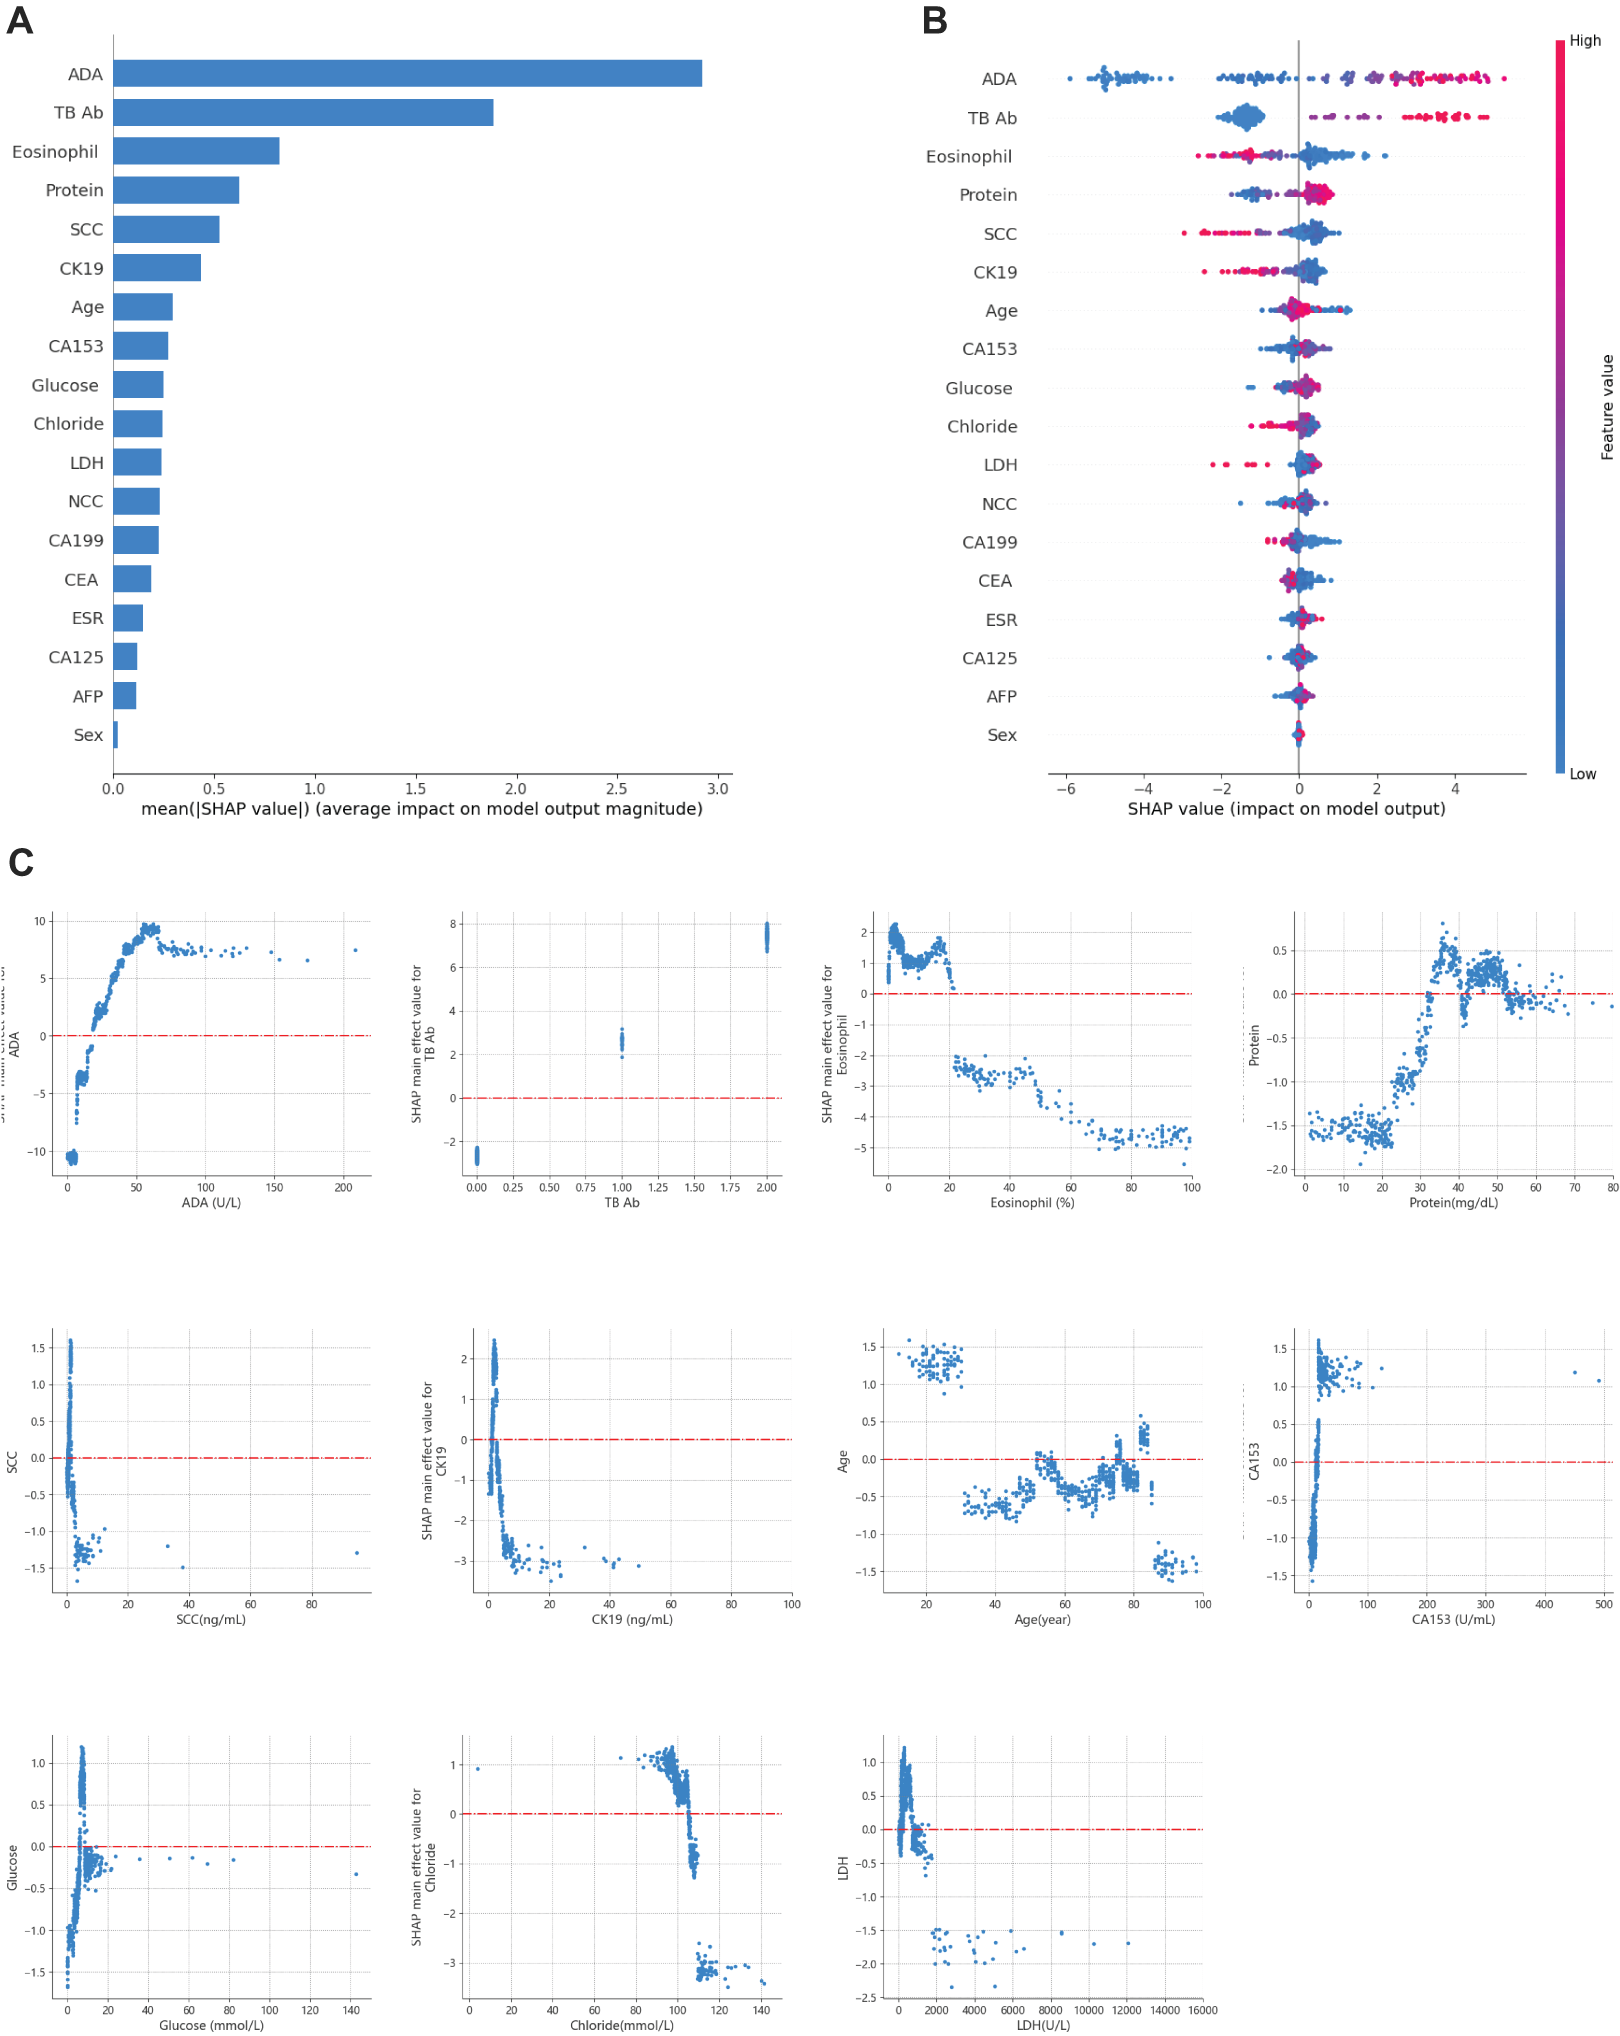
Recognizing the need for interpretability in clinical applications, SHAP values were applied to explain the model’s predictions (Lundberg & Lee, 2017). This approach allowed for global and local interpretation (Lundberg et al., 2020): At the global level, SHAP summary plots (Figs. 6A and 6B) ranked features by their average importance to the model. In contrast, SHAP dependence plots helped clarify the influence of individual features on prediction outcomes. As shown in Fig. 6C, the relationship between the actual values of the 11 key features and their corresponding SHAP values reveals that positive SHAP values favor predictions for TPE.
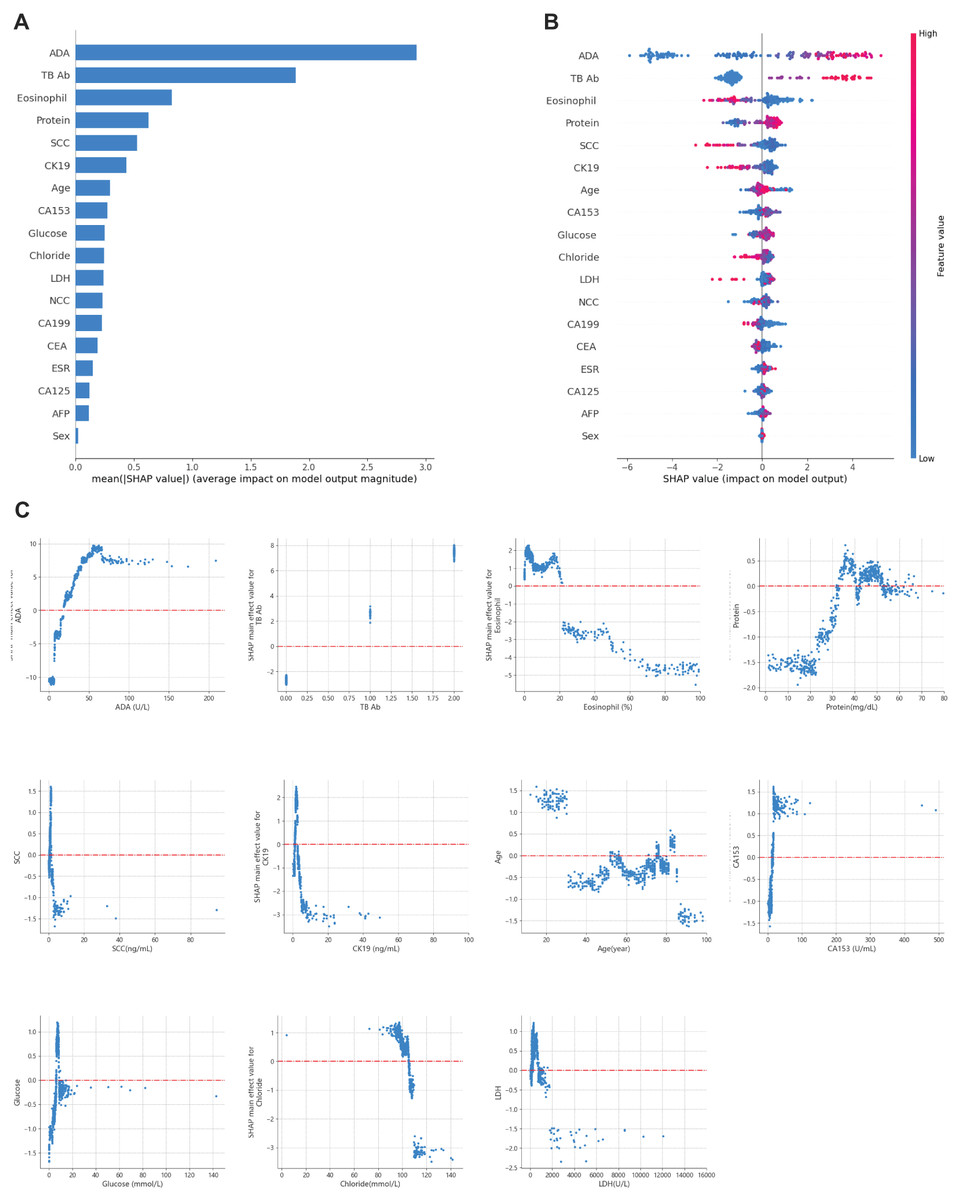
Figure 6: Global model explanation using SHAP.
(A) SHAP summary bar plot. (B) SHAP summary dot plot. The likelihood of predicting tuberculous pleural and abdominal effusion rises with higher SHAP values for the model’s features. Each dot on the plot represents a patient’s SHAP value for a particular feature, and its position along the feature axis indicates the SHAP value. The dots’ colors represent the actual feature values, where red denotes higher values, and blue denotes lower values. Vertical dot clustering shows the distribution of data points for each feature. (C) SHAP dependence plot. These plots illustrate the influence of each feature on the model’s predictions, with individual points representing patients. SHAP values are displayed on the y-axis, and the corresponding feature values are plotted on the x-axis. SHAP values above zero suggest an increased likelihood of diagnosing tuberculous pleural effusion. The summary bar plot (A) ranks features based on their importance, and the dependence plot (C) shows the relationship between key features (e.g., TB-Ab, ADA) and their contribution to predicting TPE.For example, a positive or weakly positive result in the tuberculosis antibody (TB-Ab) test (classified as 0 = negative, 1 = weakly positive, 2 = positive) is associated with a higher probability of TPE. Similarly, adenosine deaminase (ADA) levels above 20 U/L significantly increase the likelihood of TPE, especially in regions with high tuberculosis prevalence. ADA is widely recognized as a biomarker for diagnosing TPE, with levels over 40 U/L offering improved sensitivity and specificity, in line with international diagnostic standards (Aggarwal et al., 2019; Porcel, 2009).
Moreover, eosinophil counts in pleural and peritoneal fluid proved to be a critical differentiator. Data suggest that eosinophil levels between 0 and 20% are more indicative of TPE, while levels exceeding 20% point to non-tuberculous causes. This aligns with existing literature linking elevated eosinophil counts to parasitic infections, drug reactions, or malignancies.
The SHAP plots in Fig. 6 demonstrate the contribution of each feature to the diagnosis of TPE, where positive SHAP values indicate that a feature increases the probability of TPE diagnosis. For instance, ADA and TB-Ab show strong positive SHAP values, underscoring their diagnostic importance, particularly in areas with a high prevalence of tuberculosis. These insights can assist clinicians by providing transparency regarding the model’s predictions, thus facilitating more informed decision-making in a clinical setting.
Additionally, Fig. 7 presents a force plot for the internal validation set. The x-axis represents individual patients, while the y-axis displays the contribution of various features to the prediction. A more significant red portion for each patient suggests a higher likelihood of TPE diagnosis. This visualization effectively highlights how specific features influence the model’s predictions, with more significant red segments signifying a more substantial contribution to the TPE diagnosis.
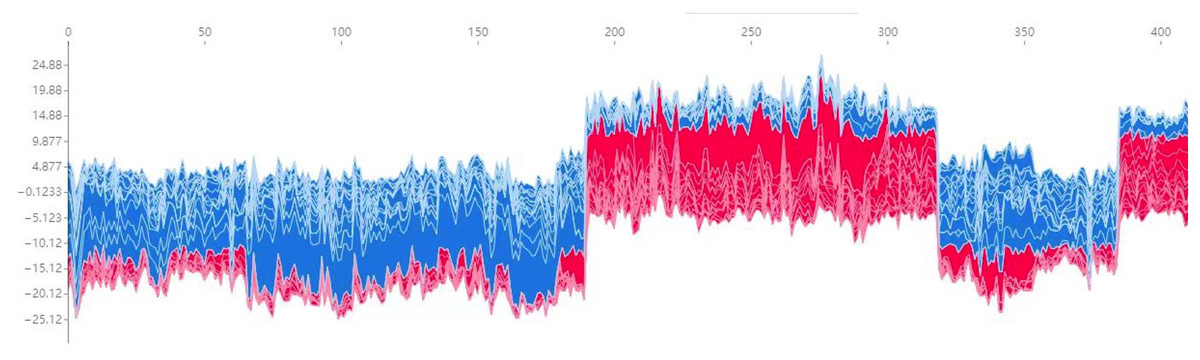
Figure 7: Force plot for the internal validation set.
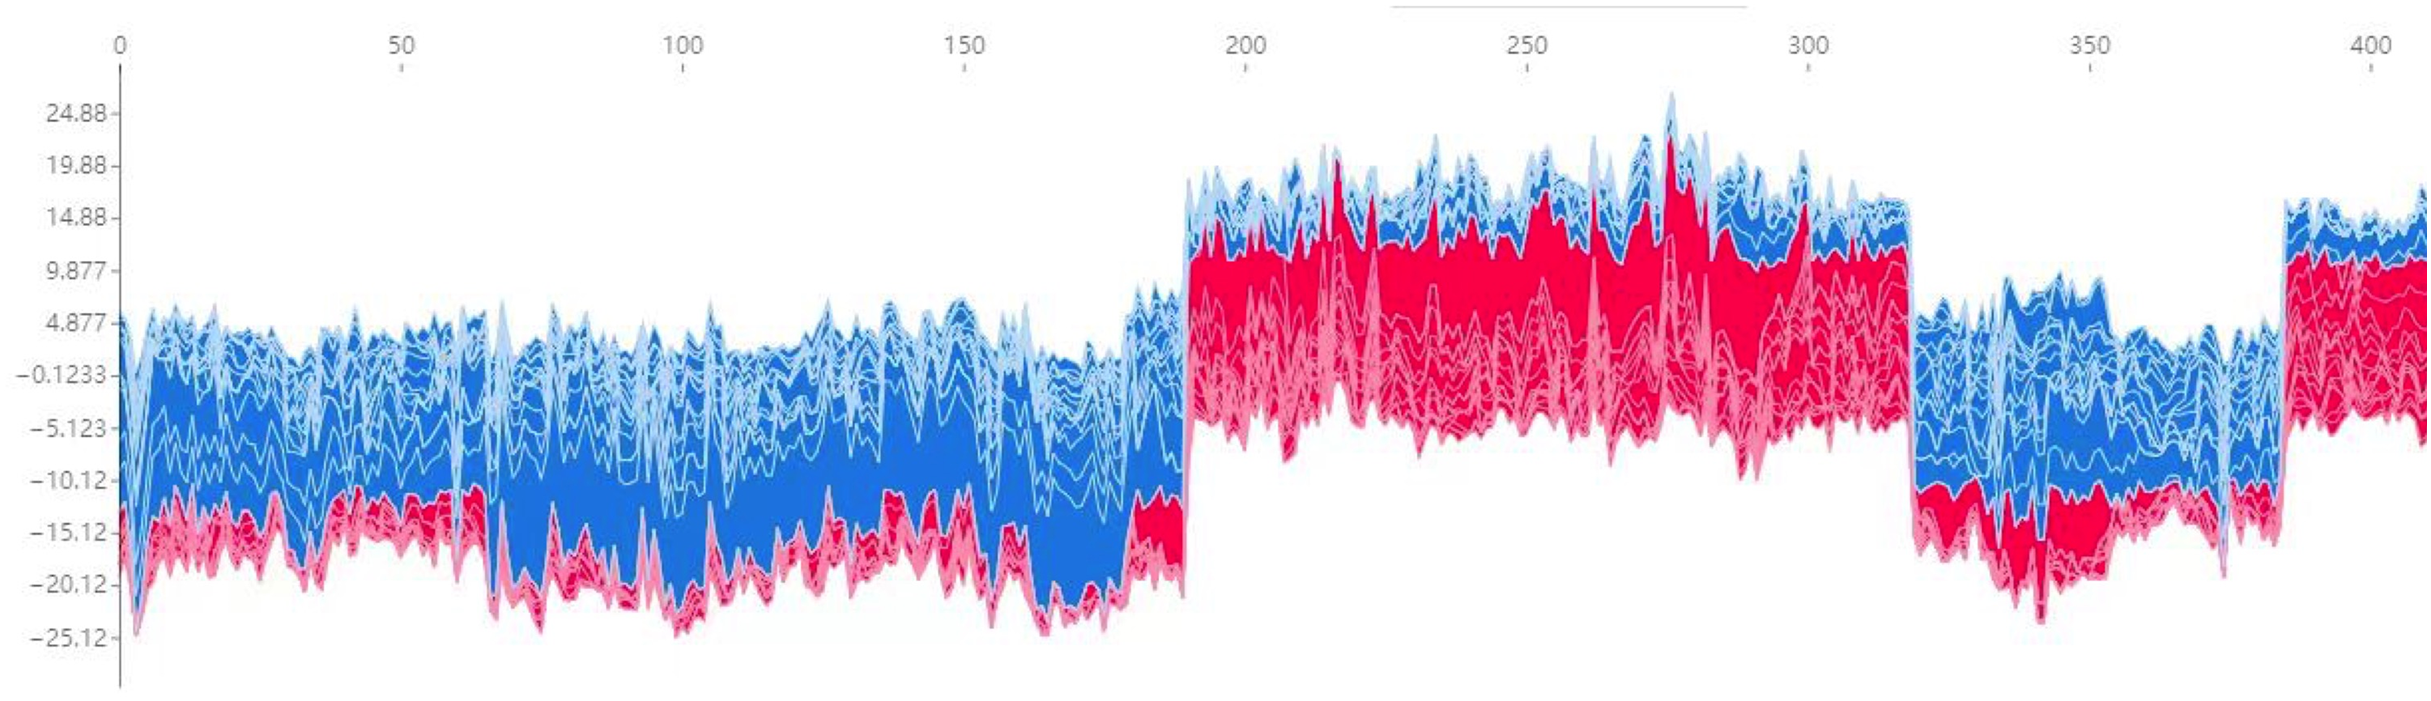
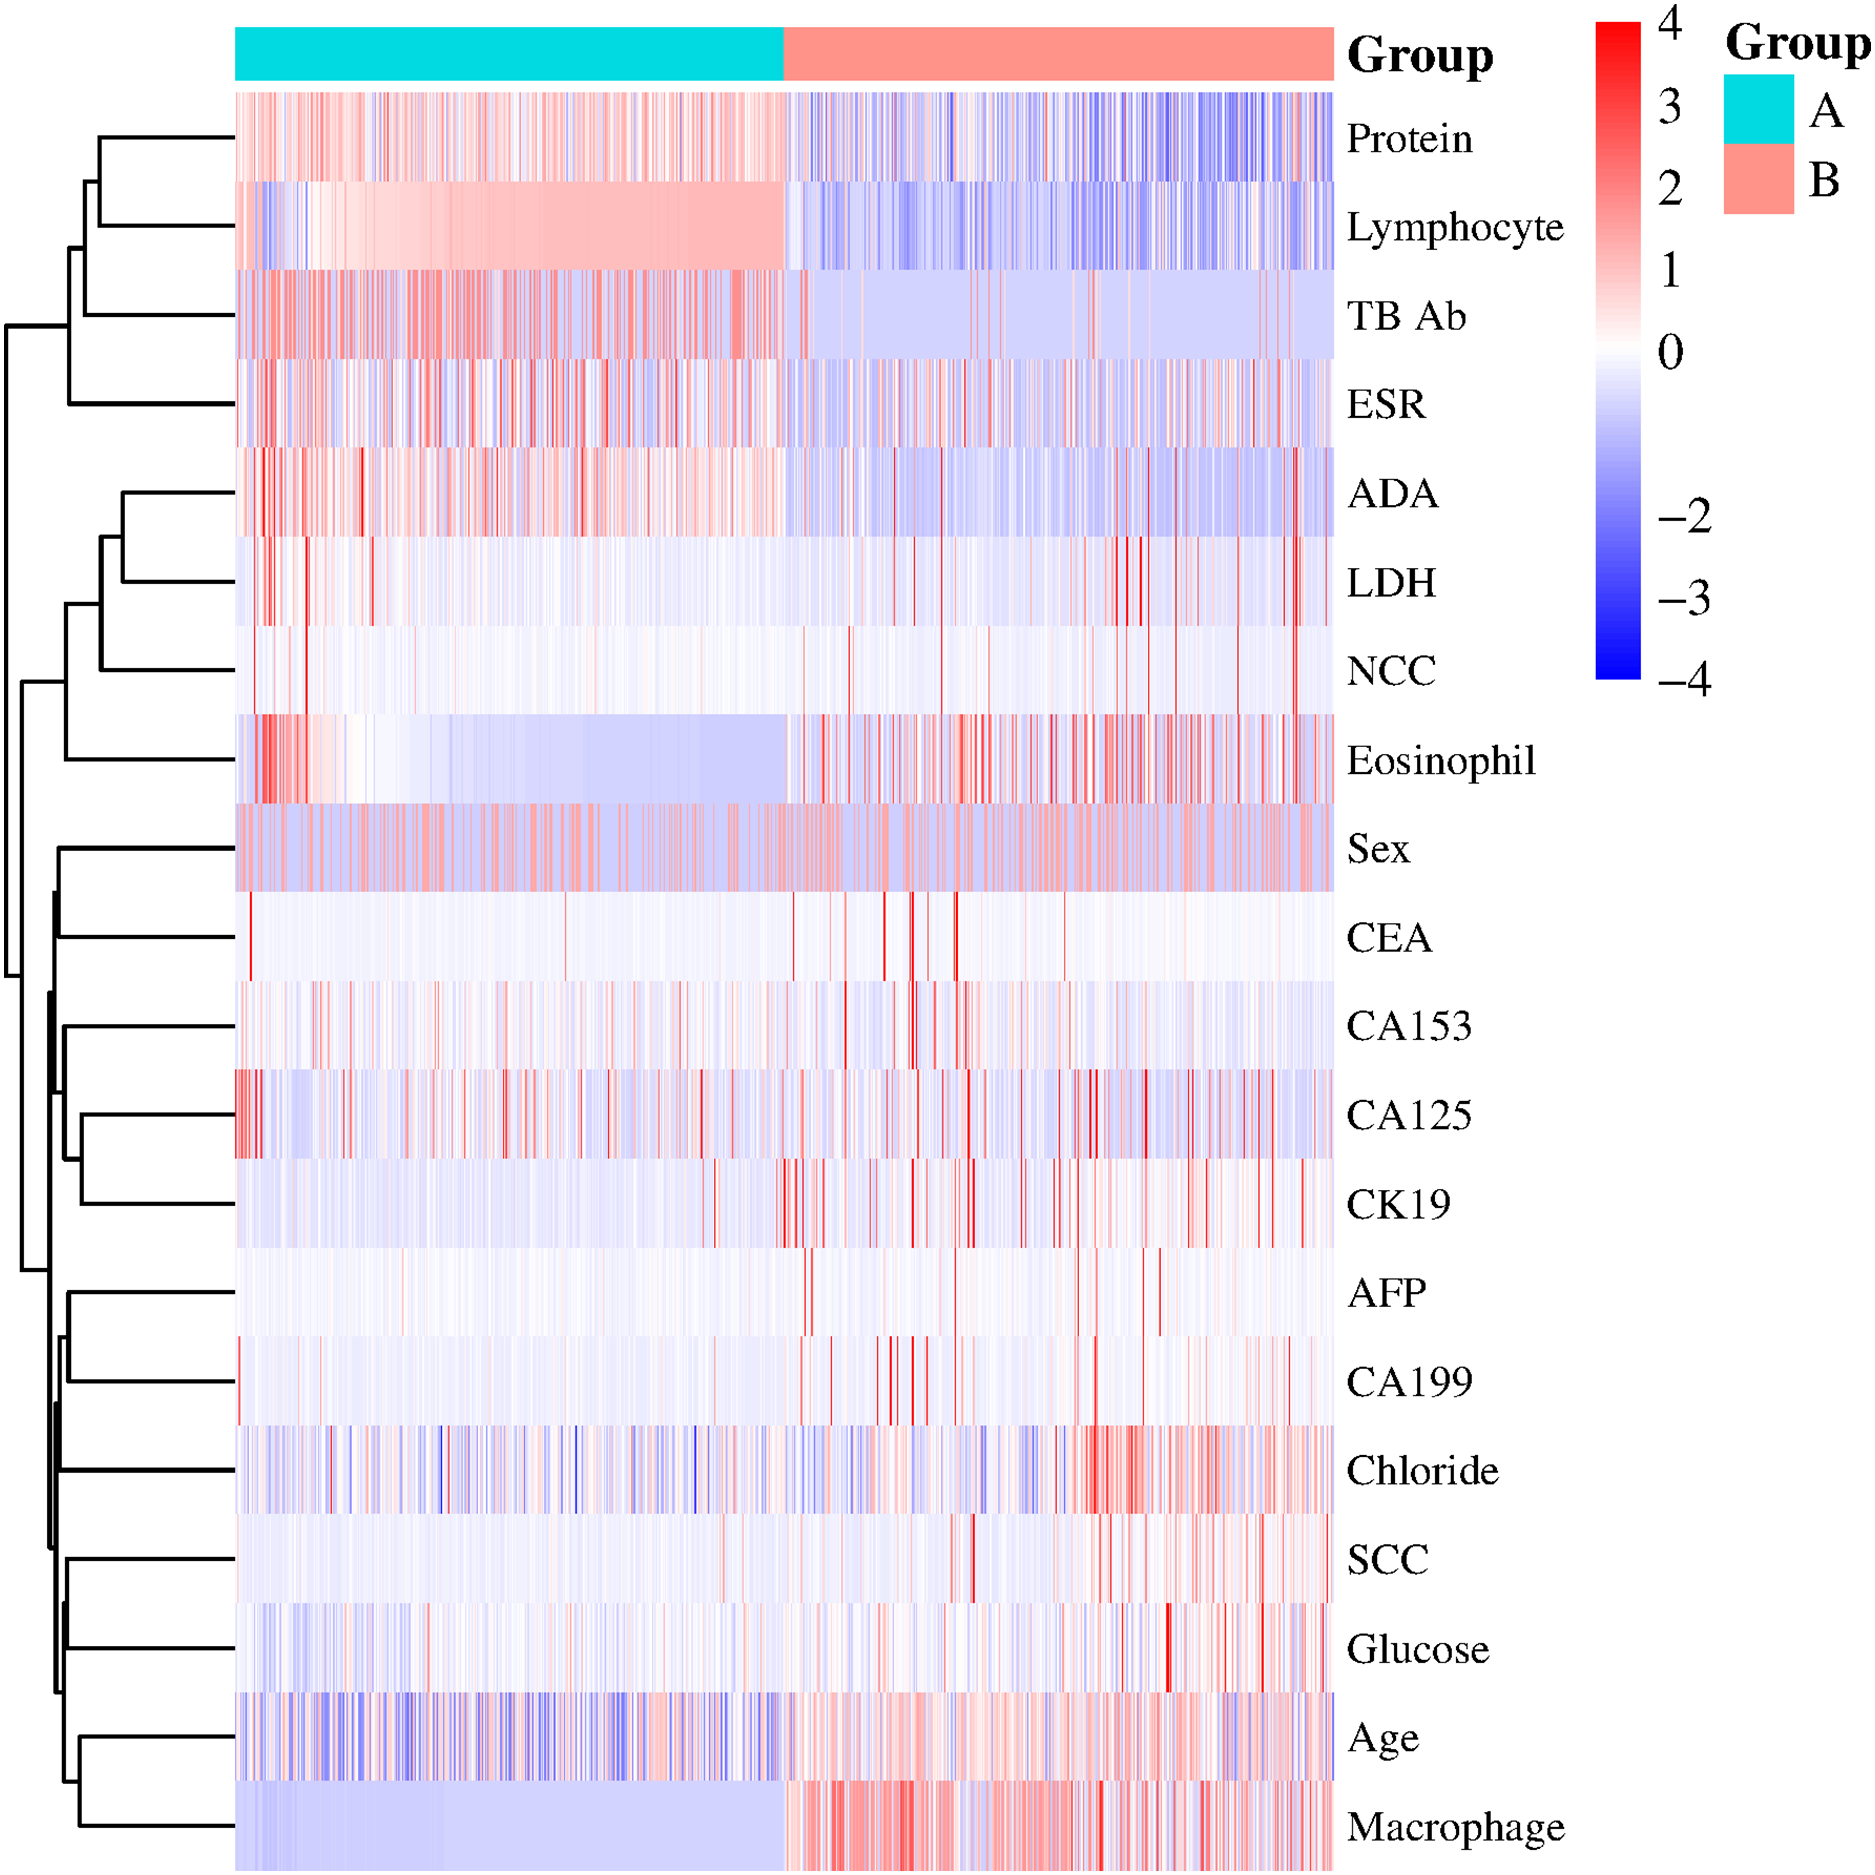
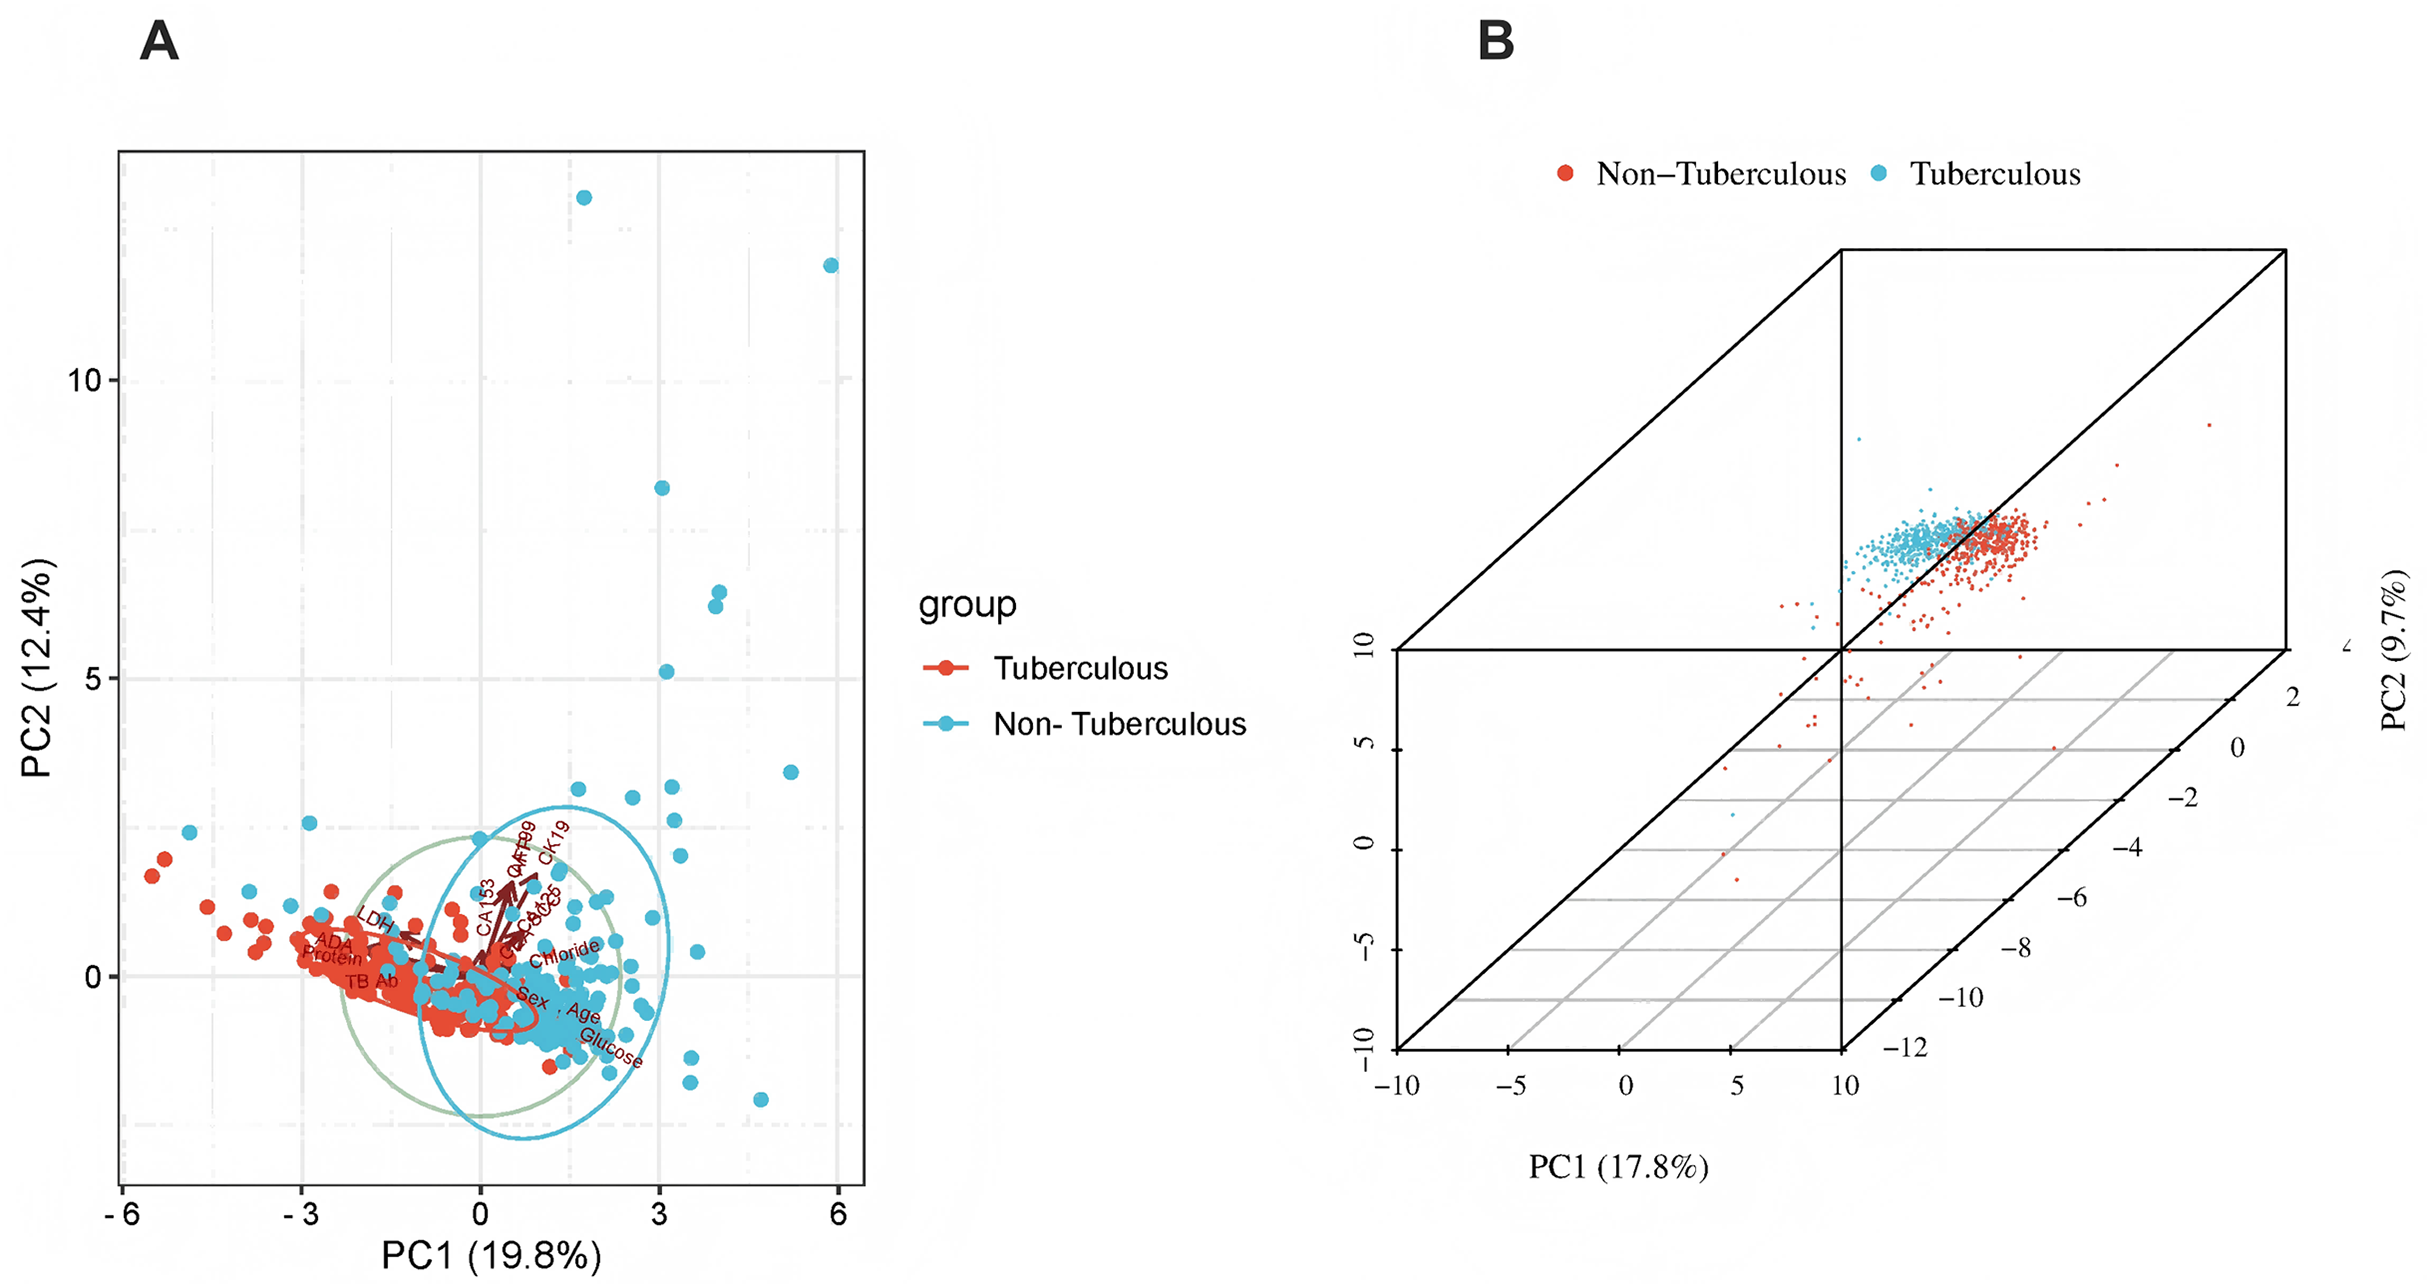
The x-axis represents individual patients, while the y-axis shows the contribution of each feature to the prediction. A more significant red portion for each patient indicates a higher likelihood of a tuberculous pleural effusion diagnosis. As the red area increases for individual patients, it indicates a higher predicted probability of tuberculous pleural effusion. This force plot highlights the contribution of individual features for each patient in the internal validation set. A higher red portion indicates a stronger contribution of that feature to the TPE diagnosis prediction.Additional visualization techniques were utilized to clarify the expression patterns of key features and their influence on classification to enhance the SHAP analysis further. The heatmap (Fig. 8) compares the standardized expression levels of various clinical and laboratory parameters between TPE and non-TPE groups. This visualization emphasizes features such as ADA and protein levels in distinguishing TPE, aligning with their high SHAP values. Additionally, principal component analysis (PCA) (Jolliffe & Cadima, 2016) (Figs. 9A, 9B) was employed to examine the distribution of feature parameters in both two-dimensional and three-dimensional spaces. The PCA plots illustrate how key features drive the separation between TPE and non-TPE cases along principal components PC1 and PC2. Notably, ADA and TB-Ab, identified as significant in the SHAP analysis and heatmap, exhibit clear group differentiation in the PCA plots. By integrating SHAP, heatmaps, and PCA, the model’s interpretability is enhanced, further reinforcing the reliability of the diagnostic model for clinical applications (Molnar, 2020).
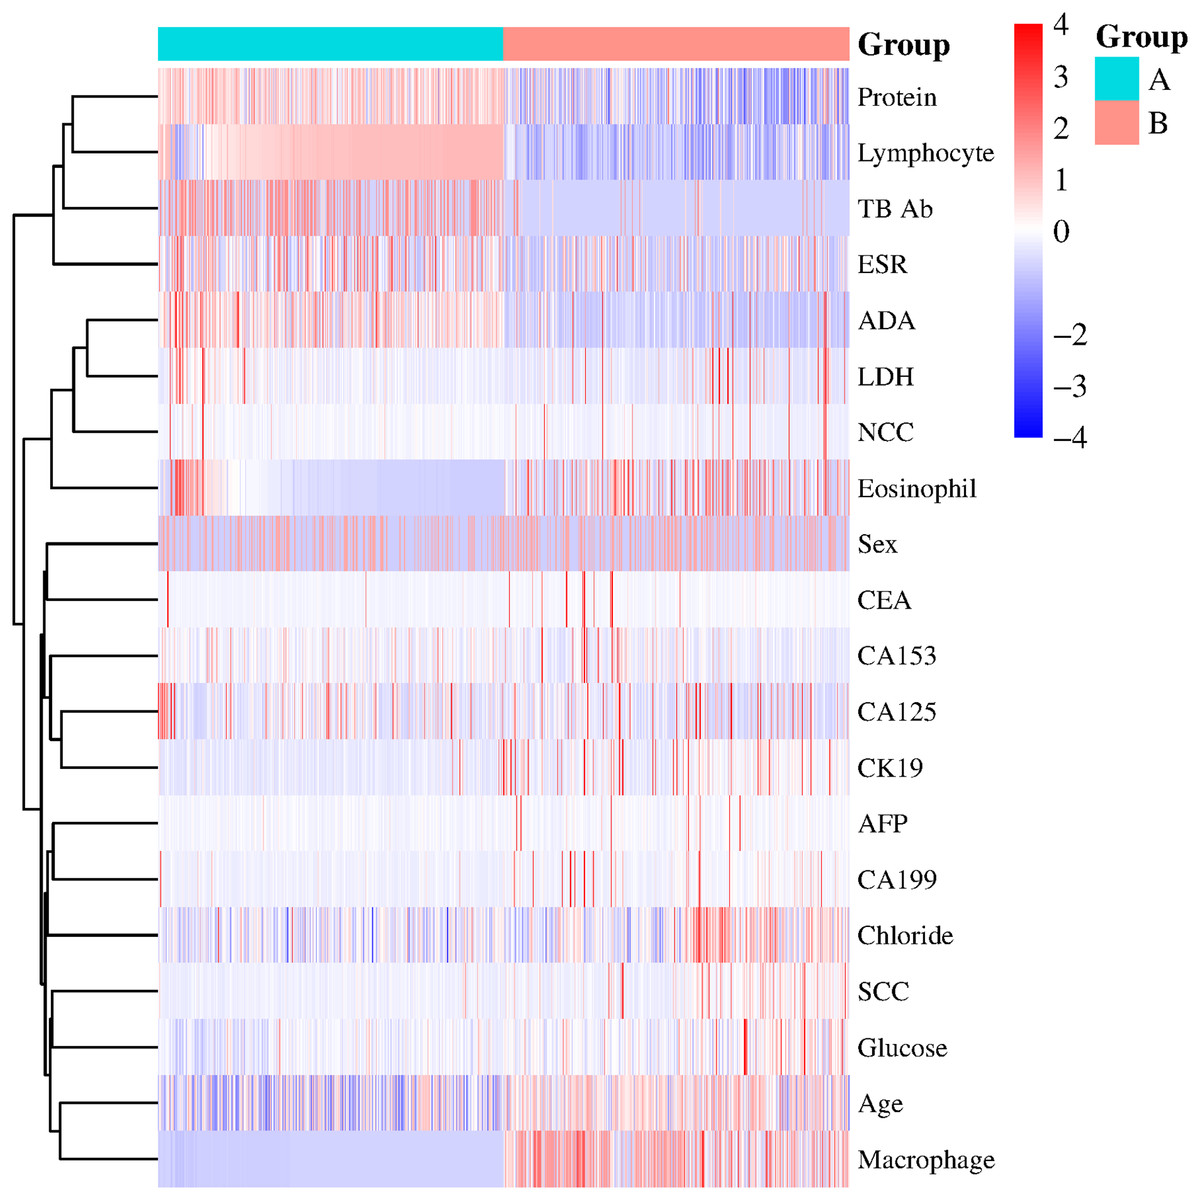
Figure 8: Heatmap of clinical and laboratory variable distribution.
Global expression changes and clustering of multi-sample, multi-feature parameters between the two groups. Group A represents tuberculous pleural effusion, while Group B represents non-tuberculous pleural effusion. Each row corresponds to a feature parameter, and each column represents a sample. The color gradient indicates standardized expression levels, with red denoting higher values and blue representing lower values. The right side of the heatmap lists the feature parameters, where closer proximity between two features suggests more remarkable similarity in their expression patterns. This heatmap compares the standardized expression levels of clinical and laboratory parameters between TPE and non-TPE groups, highlighting significant features like ADA and protein that distinguish between the two groups.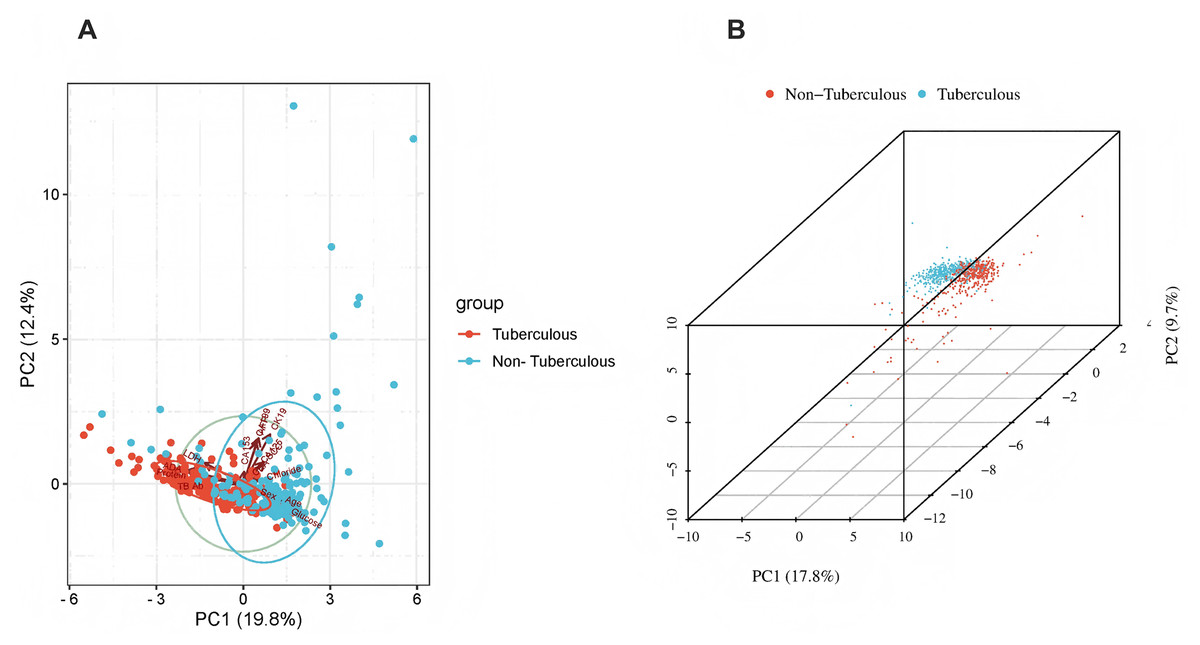
Figure 9: Principal component analysis (PCA).
(A) 2D PCA of tuberculous and non-tuberculous pleural effusion samples. (B) 3D PCA of tuberculous and non-tuberculous pleural effusion samples. PCA plots in (A) (2D) and (B) (3D) demonstrate the separation of TPE and non-TPE cases along the first and second principal components, with ADA and TB-Ab being key distinguishing features in both 2D and 3D space.This figure illustrates global expression changes and clustering of multi-sample, multi-feature parameters between the two groups. Group A represents tuberculous pleural effusion, while Group B represents non-tuberculous pleural effusion. Each row corresponds to a feature parameter, and each column represents a sample. The color gradient indicates standardized expression levels, with red denoting higher values and blue representing lower values. The right side of the heatmap lists the feature parameters, where closer proximity between two features suggests more remarkable similarity in their expression patterns. This heatmap compares the standardized expression levels of clinical and laboratory parameters between TPE and non-TPE groups, highlighting significant features like ADA and protein that distinguish between the two groups.
Practical clinical application
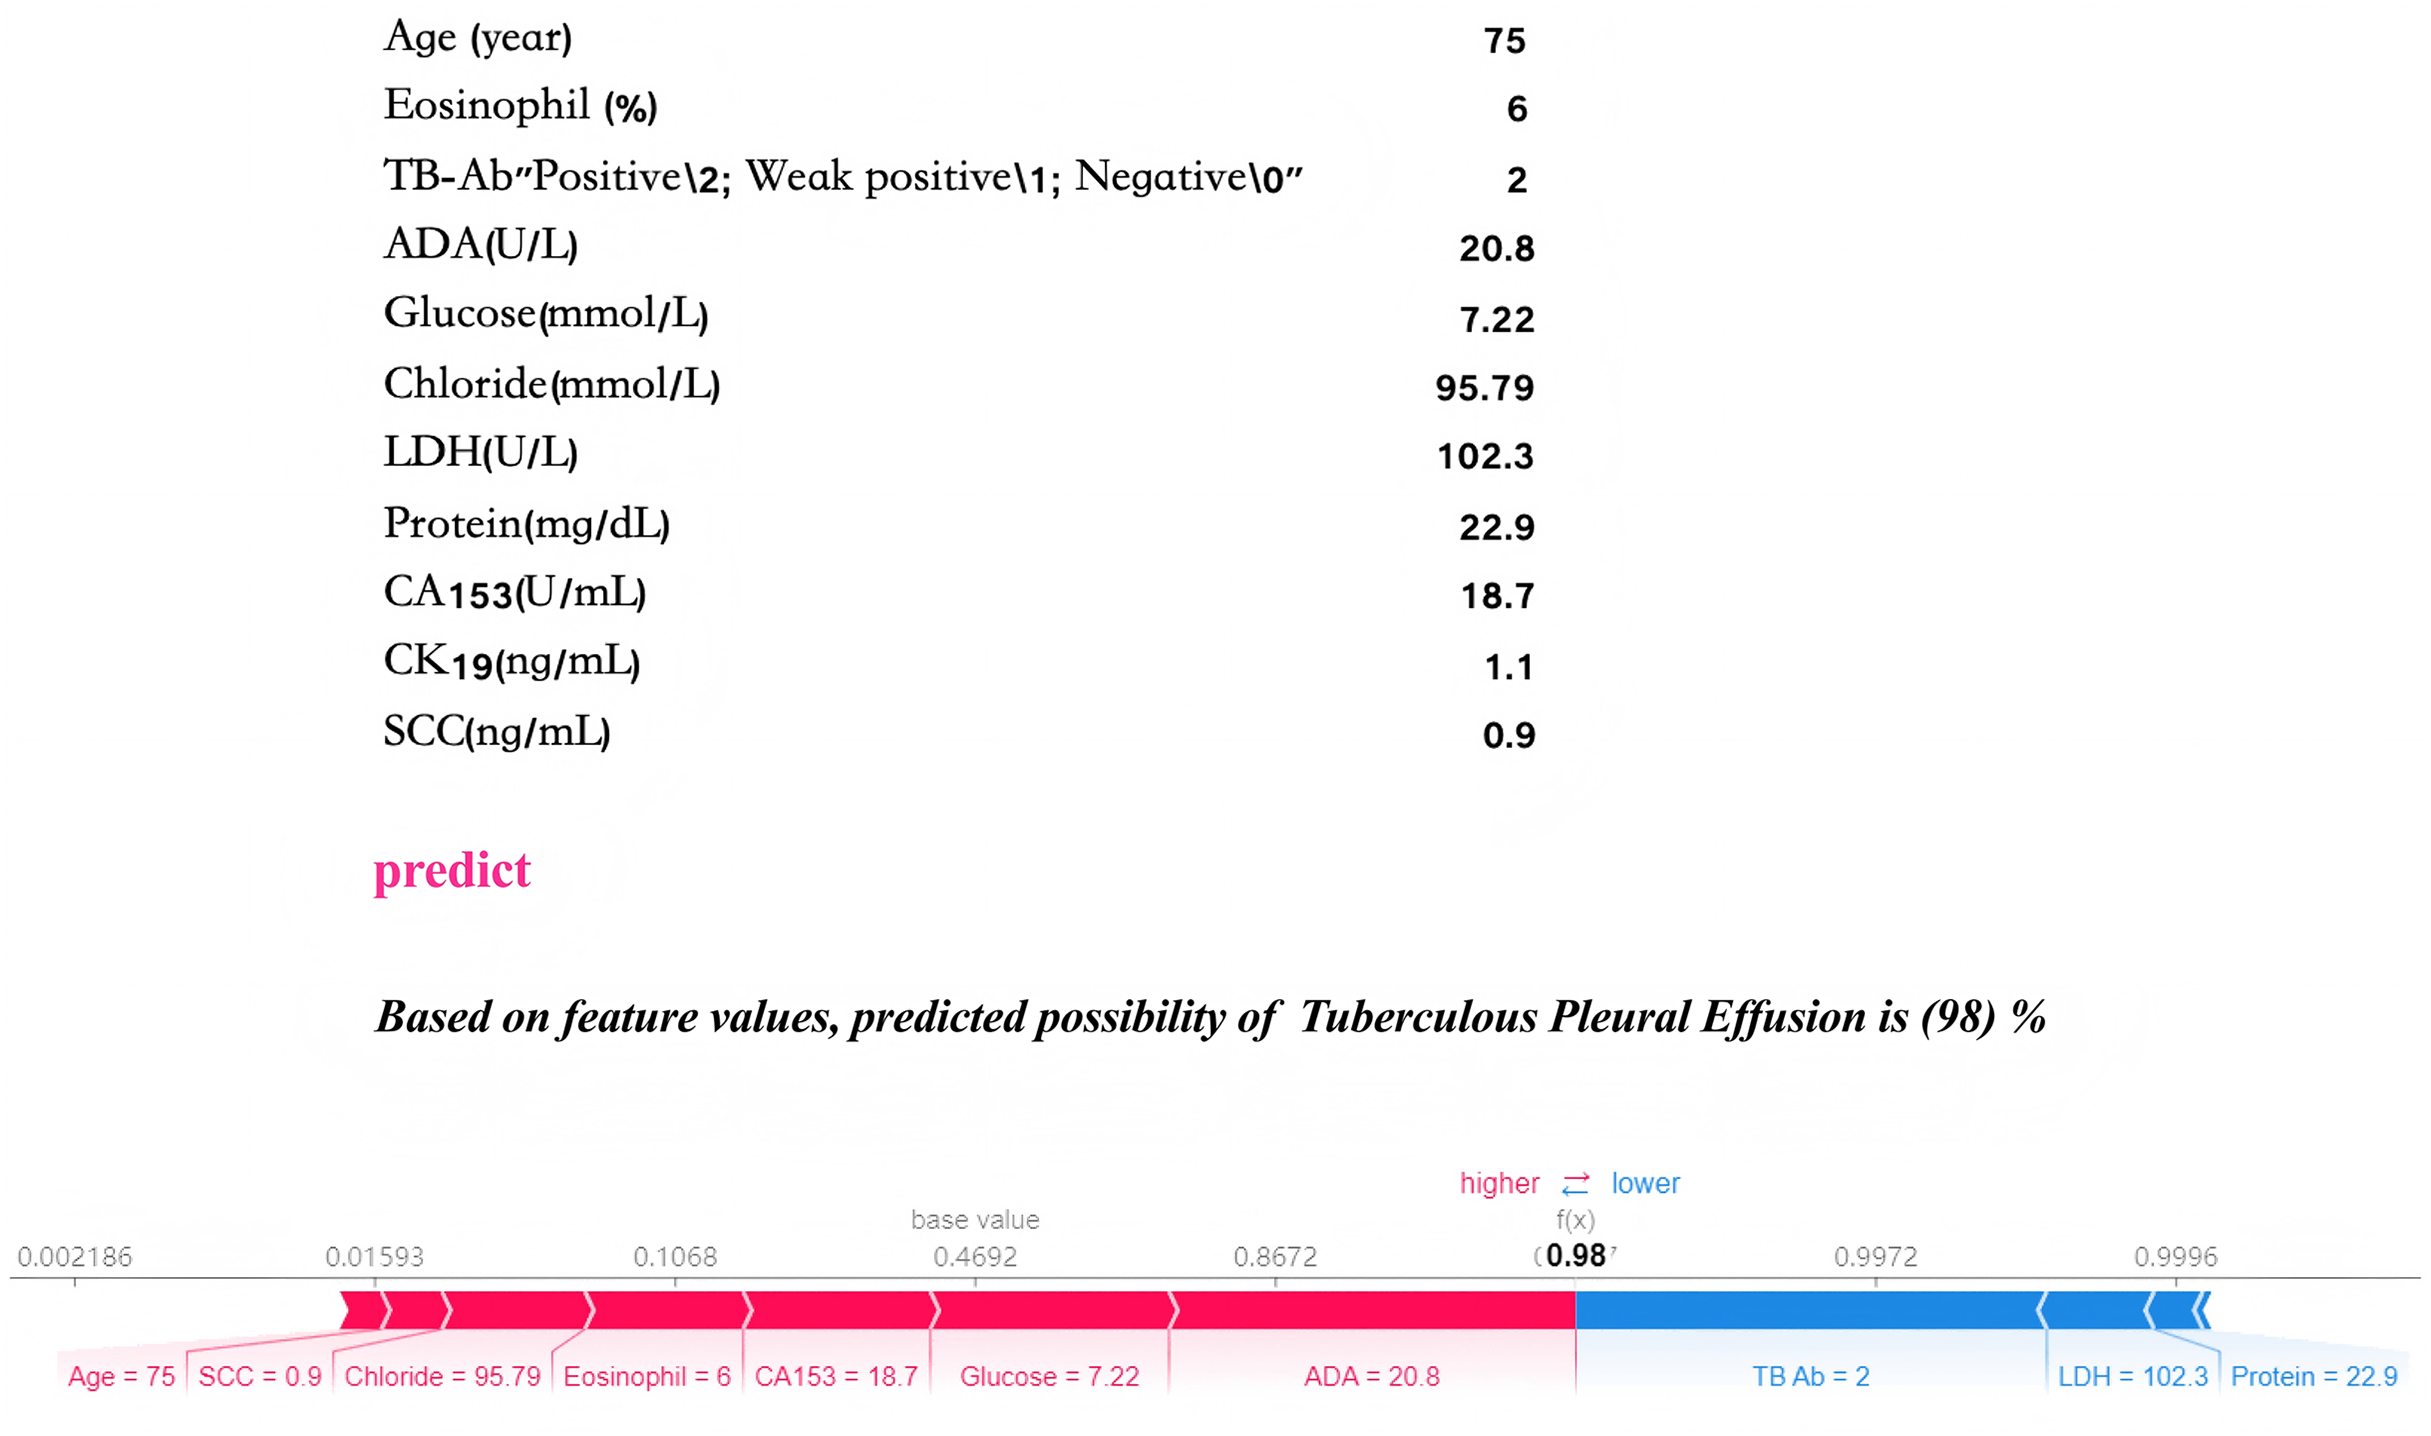
Local interpretability analysis enables personalized input data to predict outcomes for individual pleural effusion patients. The predictive model has been embedded into an application to enhance its clinical applicability, as illustrated in Fig. 10. In the given example, with specific parameter inputs, the model generates a 98% probability for TPE and a 2% probability for non-TPE. Each prediction is tailored to the individual, based on the actual values of the 11 input features, with varying inputs resulting in different probability outcomes.
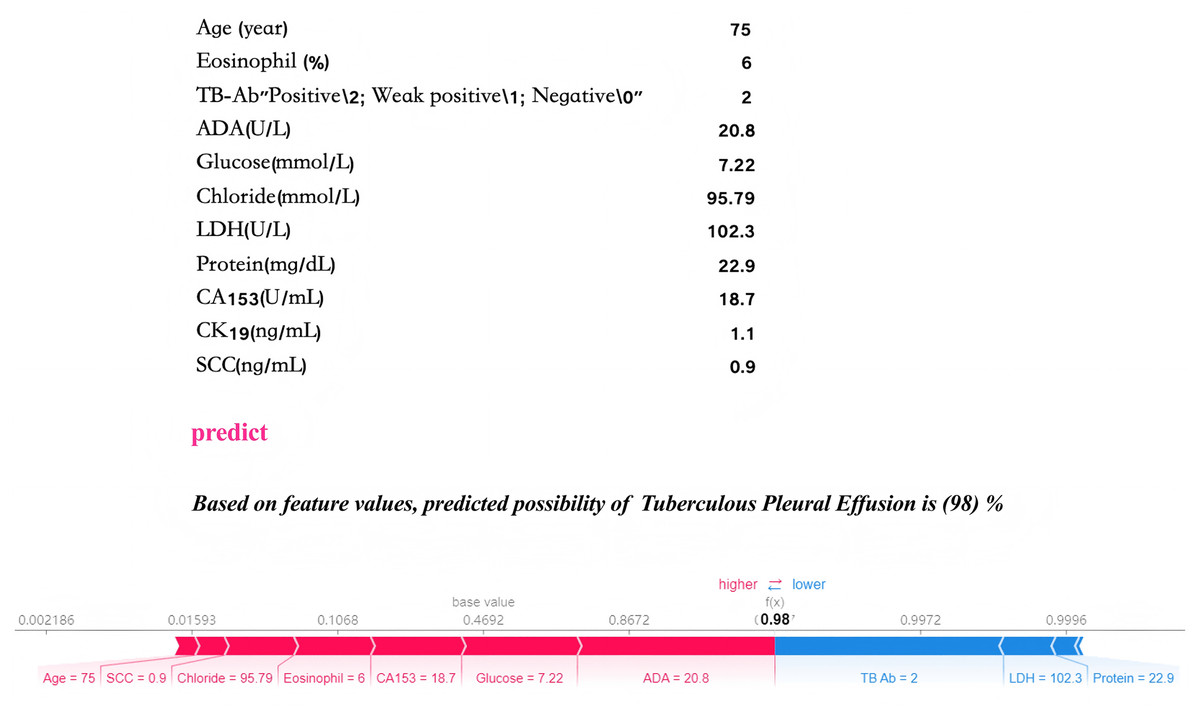
Figure 10: Practical clinical application.
The final LGBM model, incorporating 11 features, provides a user-friendly tool for predicting tuberculous pleural effusion in a clinical setting. Upon inputting the actual values of the 11 feature parameters, the application promptly calculates and displays a 98% probability, offering an efficient and accessible diagnostic aid. By inputting patient laboratory data, the model provides real-time TPE risk predictions, as shown by a 98% probability for TPE diagnosis in a sample case.Discussion
This study developed and validated an LGBM model based on routine laboratory data to diagnose noninvasive TPE. By incorporating SHAP analysis, the model’s interpretability was enhanced, allowing clinicians to understand the contribution of each feature to the diagnostic outcome, thus addressing the “black box” problem typically associated with machine learning (Gunning et al., 2019; Holzinger et al., 2017). Shapley explainability helps us understand how each piece of data (like a patient’s age or test results) contributes to the model’s decision. It is like asking the model, “Why did you make this decision?” Shapley gives a clear answer by telling us how much each factor influenced the final prediction. This makes the model more transparent and easier for clinicians to trust and interpret. Similar to the work of Welchowski et al. (2021) in ecological studies, who utilized partial dependence plot (PDP), individual conditional expectation (ICE), and accumulated local effects (ALE) tools to reveal variable response relationships in ‘black box’ models, our study demonstrates the significant value of explainable machine learning models in clinical diagnostics. Compared to traditional invasive diagnostic methods, the LGBM model demonstrated higher sensitivity and specificity in resource-limited settings, significantly improving diagnostic efficiency and accuracy. The AUC for internal validation was 0.9454, and the mean AUC for five-fold cross-validation was 0.9262. In external validation, sensitivity reached 0.8600, and specificity was 0.9056, illustrating the model’s robustness and broad applicability. This study presents a novel approach to TPE diagnosis by combining LGBM, which efficiently handles high-dimensional and imbalanced data, with SHAP for model interpretability. While traditional machine learning methods such as random forests have been used for TPE diagnosis, they often lack the robustness and transparency required in clinical settings. Our method not only improves diagnostic accuracy but also allows for better understanding of feature importance, which is crucial for clinical decision-making. The integration of both high-performance machine learning and interpretability makes our approach unique compared to previous studies. The LGBM model showed good performance with high sensitivity and specificity for diagnosing TPE. To address class imbalance, we also experimented with SMOTE, ADASYN, and class weight adjustments. The results indicated that these techniques enhanced the model’s sensitivity to the minority class, improving recall and overall accuracy, especially for cases with low expression of TPE.
Compared to the random forest model used by Ren, Hu & Xu (2019). LGBM achieved a higher AUC and provided greater clinical interpretability through SHAP analysis (Wang et al., 2024). In regions with a high prevalence of tuberculosis, features such as ADA and TB-Ab were particularly important. Furthermore, LGBM reduced training time by approximately 30% compared to the random forest and GBDT when handling high-dimensional and imbalanced data while maintaining high predictive accuracy. SHAP analysis further revealed the diagnostic value of critical features, enhancing the clinical utility of the model. Research by Dorsch & Moll (2024) suggests that explainable AI methods can improve the trustworthiness of clinical decision-making. Muschalik et al. (2024) also developed the Sharqi tool, which enhanced the interpretability of models like XGBoost and LGBM.
Although random forest performs well in handling complex data and high-dimensional features, it comes with high computational costs and poor interpretability. In contrast, LGBM enhances accuracy and stability by integrating multiple weak learners, while maintaining high computational efficiency. SVM works well with small sample binary classification problems, but it tends to overfit when dealing with large datasets and lacks intuitive interpretability, limiting its clinical application. In our study, LGBM improved the accuracy of TPE diagnosis by optimizing feature weighting, especially in cases with incomplete data or small sample sizes. SHAP analysis further enhanced the interpretability of LGBM, allowing clinicians to better understand the model’s predictions. Comparisons with other methods further demonstrate LGBM’s advantages in handling high-dimensional data, improving prediction accuracy, and reducing computational costs.
Sample size and multicenter validation
While this study demonstrated the model’s robustness (Xu & Mannor, 2012), the external validation sample size was small and limited to two medical centers, which may affect its generalizability (James et al., 2013; Hastie, 2009). Future studies will expand the sample size through multicenter collaborations, covering a more comprehensive geographic range and diverse patient populations, to further validate the model’s generalization capabilities. While the model performed well on both internal and external validation datasets, the training data from two hospitals in Zhejiang may introduce regional biases. These biases could affect the generalizability of the model to other populations. Future work should address this by including more diverse data. We acknowledge that potential confounders, such as age, gender, and comorbidities (e.g., diabetes, cardiovascular diseases), may affect the model’s results. Although multivariable adjustments were made in the analysis, these factors may still influence the outcomes. Future studies could further control for these confounders to validate the model’s accuracy and robustness.
Multimodal data integration
Future research could further integrate imaging data (such as chest CT) and genomic data to address the current limitations and improve diagnostic accuracy. Additionally, the systematic review and meta-analysis by Du et al. (2023). on the ability of machine learning to predict AKI risk in patients in the ICU further underscore the significance of machine learning in complex clinical diagnostics, suggesting that similar approaches may apply to the diagnosis of infectious diseases like TPE. Imaging can provide structural information on pleural effusion, while genomic data may reveal genetic susceptibility to TPE. Integrating multimodal data could enhance the model’s applicability (Acosta et al., 2022) in complex clinical scenarios (Liu et al., 2024).
Limitations and future outlook
Although the LGBM model in this study demonstrated high diagnostic accuracy, several limitations remain, including limitations in sample size and data sources (especially the limited data for low-expression TPE cases), data quality and feature selection (such as potential measurement errors or unaccounted factors), and the model’s dependency on input features and hyperparameters (which may be affected by dataset bias or overfitting). Furthermore, the model’s clinical applicability remains limited by factors such as data collection methods, hospital equipment, and clinical environments. The model’s interpretability and clinical usability also need further validation, particularly in multi-center and long-term follow-up studies.
While this study validated the effectiveness of the LGBM model, relying solely on routine laboratory data may not be sufficient for all complex clinical scenarios. Future research should expand the sample size and include other types of pleural effusion (such as malignant pleural effusion) to assess the model’s generalizability. Additionally, optimizing the model’s real-time interpretability will enhance its clinical utility. To improve diagnostic efficiency, the model will be integrated into Hospital Information Systems (HIS) and Laboratory Information Systems (LIS) for real-time data input and automated diagnosis, particularly in resource-limited areas.
Future research directions
Future research will focus on the following areas: expanding the sample size through multicenter collaborations to ensure the model’s generalizability across different regions and populations and exploring the integration of imaging and genomic data to develop more accurate multimodal diagnostic models. The study by Bai et al. (2024) demonstrated that a multimodal approach combining MRI and ultrasound performed excellently in breast disease diagnosis, suggesting that multimodal imaging may also hold potential for TPE diagnosis. Oh et al. (2024) successfully utilized convolutional neural networks (CNN) to detect and classify brain tumors, further highlighting the possibility of combining imaging data with machine learning models for early diagnosis of complex diseases. Lastly, future studies could adopt the TDA-LGBM algorithm proposed by Yang et al. (2024), which uses topological structures to optimize model performance.
Cost-effectiveness analysis
To assess the clinical feasibility of the LGBM model, future studies should consider a cost-effectiveness analysis. While implementing the model may require investments in hardware, software, and staff training, its potential benefits—such as improved diagnostic efficiency, reduced misdiagnoses, and saved healthcare resources—could far exceed the initial costs. Additionally, the automation of the model can reduce reliance on manual labor, further lowering long-term operational expenses. Therefore, a thorough cost-effectiveness evaluation will be crucial for supporting the broader adoption of the model.
In conclusion, the LGBM model offers an efficient and interpretable solution for the noninvasive early diagnosis of TPE. The model’s diagnostic accuracy and clinical potential are expected to advance by integrating multimodal data and validation through multicenter trials.
Conclusion
The primary objective of this study was to create a risk assessment application for high-risk TPE using the LGBM model. This application enables clinicians to generate real-time risk predictions for TPE by inputting patient laboratory data, thus streamlining the diagnostic process while providing personalized risk assessments. Future efforts aim to enhance clinical utility (Sittig et al., 2008; Sutton et al., 2020) by integrating the application with existing HIS and LIS to facilitate seamless, real-time data entry. Additionally, multicenter clinical trials will validate the model’s performance across different clinical settings.
Supplemental Information
Additional Information and Declarations
Competing Interests
Author Contributions
Bihua Yao conceived and designed the experiments, performed the experiments, analyzed the data, prepared figures and/or tables, authored or reviewed drafts of the article, and approved the final draft.
Xingyu Yu conceived and designed the experiments, performed the experiments, analyzed the data, prepared figures and/or tables, authored or reviewed drafts of the article, and approved the final draft.
Liannv Qiu conceived and designed the experiments, performed the experiments, prepared figures and/or tables, authored or reviewed drafts of the article, and approved the final draft.
Er-min Gu performed the experiments, prepared figures and/or tables, authored or reviewed drafts of the article, and approved the final draft.
Siyu Mao performed the experiments, prepared figures and/or tables, authored or reviewed drafts of the article, and approved the final draft.
Lei Jiang performed the experiments, prepared figures and/or tables, authored or reviewed drafts of the article, and approved the final draft.
Jijun Tong conceived and designed the experiments, performed the experiments, prepared figures and/or tables, authored or reviewed drafts of the article, and approved the final draft.
Jianguo Wu conceived and designed the experiments, performed the experiments, prepared figures and/or tables, authored or reviewed drafts of the article, and approved the final draft.
Human Ethics
The following information was supplied relating to ethical approvals (i.e., approving body and any reference numbers):
The study adhered to the principles of the Declaration of Helsinki and received approval from the Medical Ethics Committee of Zhejiang Provincial People’s Hospital (Approval No. Zhejiang Provincial People’s Hospital Ethics 2024 -033, Acceptance No. QT2024028) and the Medical Ethics Committee of The First People’s Hospital of Jiashan (Approval No. Jiashan Ethics 2024-056, Acceptance No. LW2024021). Given the retrospective design, the Ethics Committees granted a waiver for the requirement of individual informed consent.
Data Availability
The following information was supplied regarding data availability:
The data and code is available at GitHub and Zenodo:
- https://github.com/bingbaise/The-model/tree/NEW
- bingbaise. (2024). bingbaise/The-model: 0.1 (NEW). Zenodo. https://doi.org/10.5281/zenodo.14048379.
Funding
This work was supported by the Scientific Research Fund of Zhejiang Provincial Education Department, China (No. Y202045308); the fund of the Zhejiang Province Medical and Health Science and Technology Project, China (No. 2022KY877); the fund of the Jiashan Bureau of Science and Technology, China (No. 2023A60). The funders had no role in study design, data collection and analysis, decision to publish, or preparation of the manuscript.
